
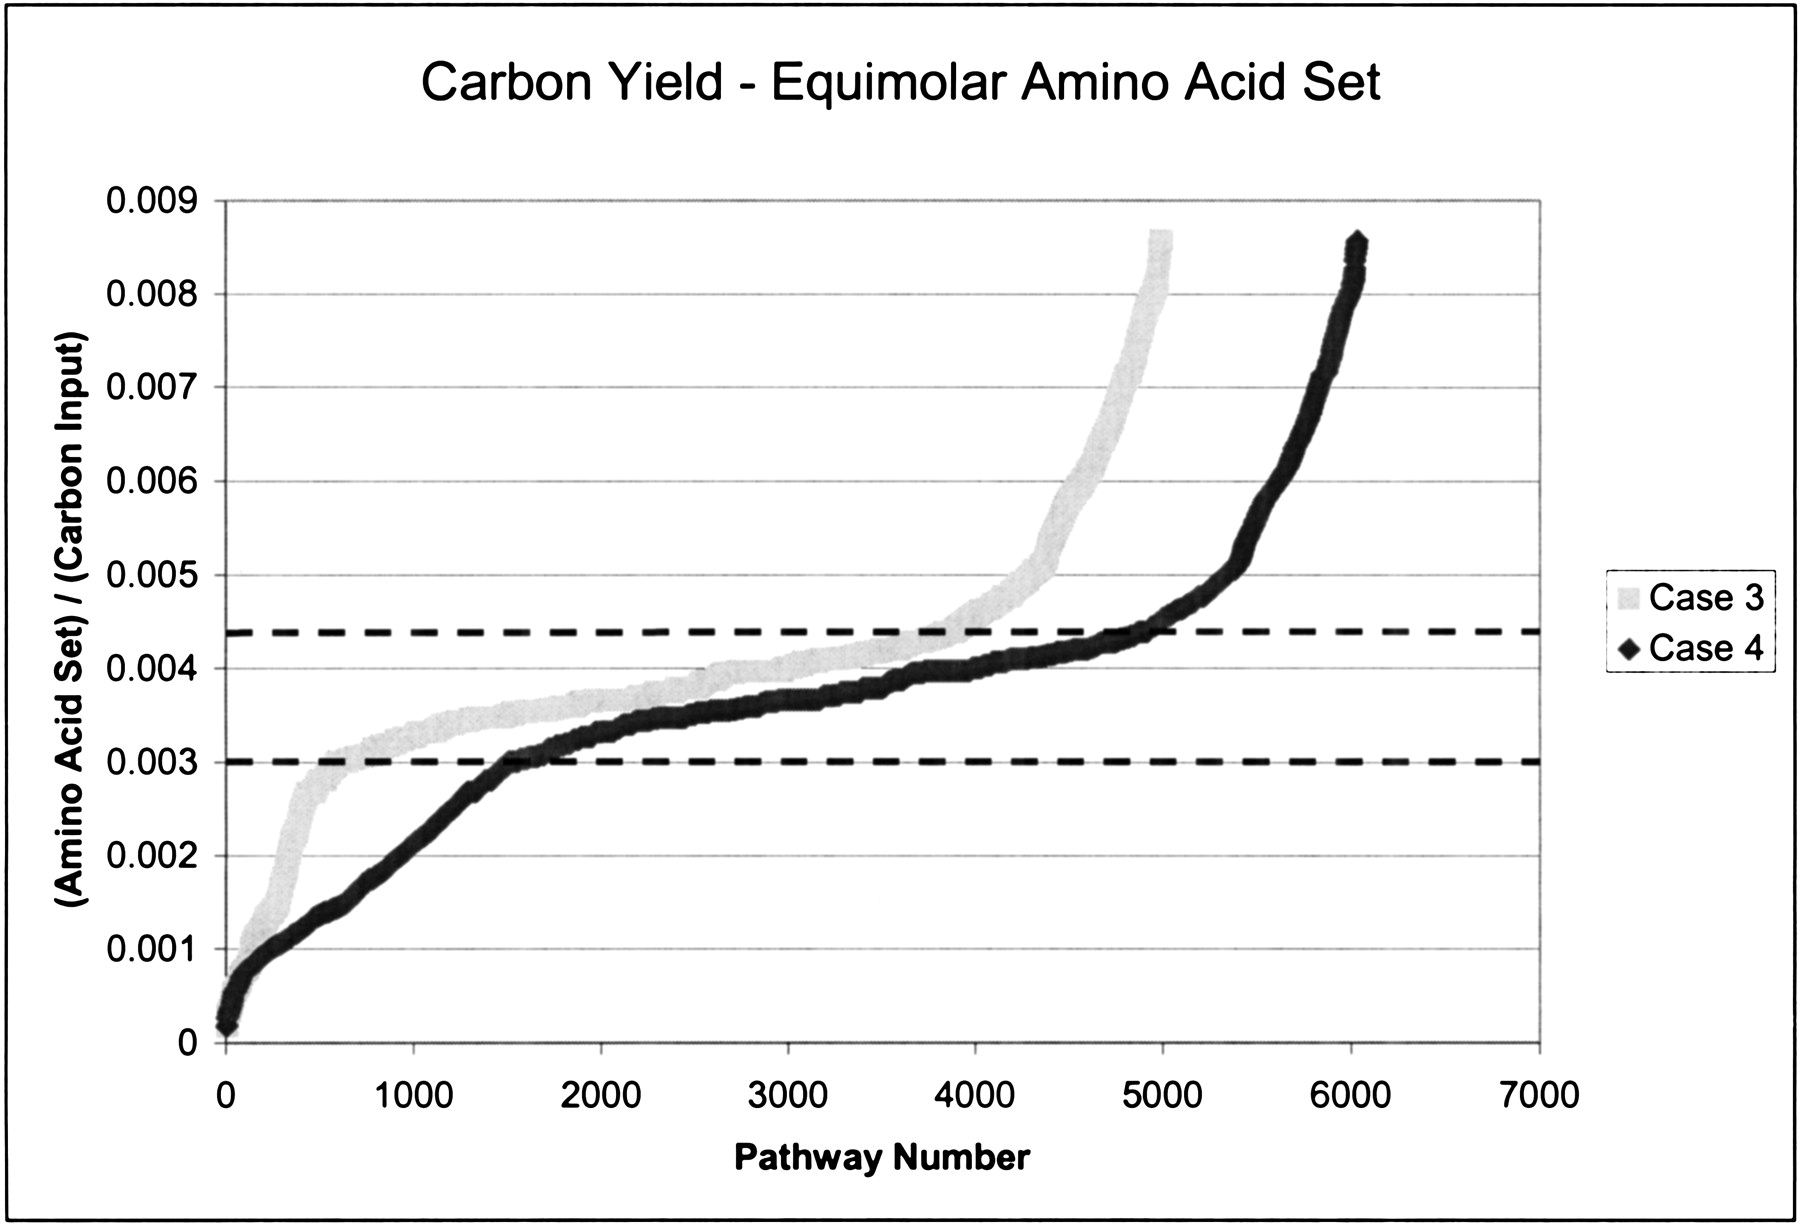
Figure 3.
Plot of carbon yield values for the production of equimolar amino acid sets. Cases 3 and 4 are presented. The pathway values between the two cases do not correlate with each other; both data sets are independently rank ordered in terms of increasing yield. The pathways with yield values between the two dashed lines (spanning 17% of the range of yield values) correspond to 66% and 57% of the total number of pathways for cases 3 and 4, respectively.


