
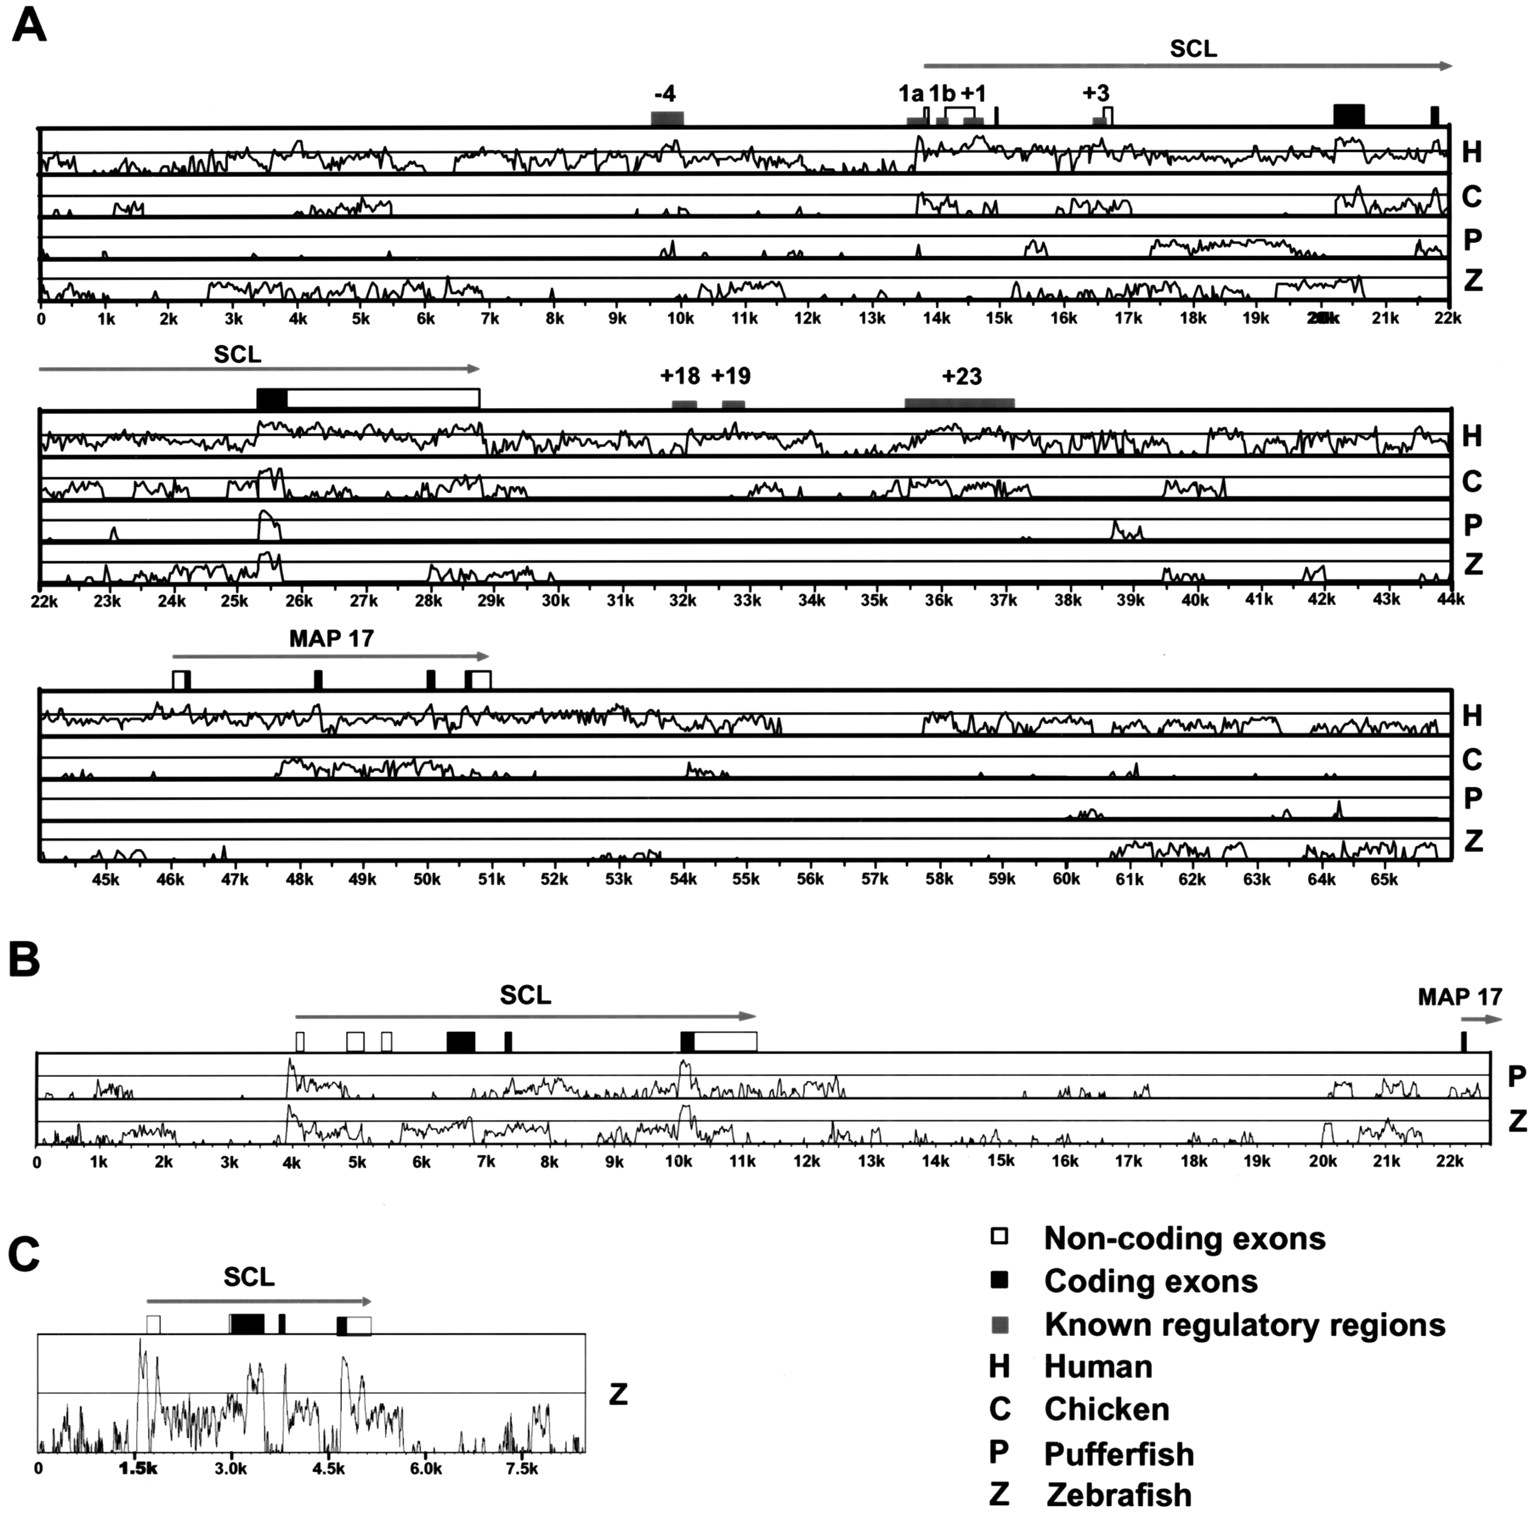
Comparative sequence analysis of vertebrate SCL loci. (A) VISTA global alignment plots displaying similarity between the mouse locus (used as the reference sequence) and the human (H), chicken (C), pufferfish (P), and zebrafish (Z) loci. Gray boxes indicate the positions of known mouse regulatory regions. Black and white boxes depict exons with the coding part shaded red. (B) VISTA global alignment plots displaying sequence similarity of chicken SCL locus (used as the reference sequence) and pufferfish (P) and zebrafish (Z) SCLloci. (C) VISTA global alignment plot displaying sequence similarity between the pufferfish locus (used as the reference sequence) and the zebrafish (Z) SCL locus. VISTAplots (Mayor et al. 2000) depicted in A to C were calculated using a 50-bp window and displayed using a 25% lower cut-off limit.


