
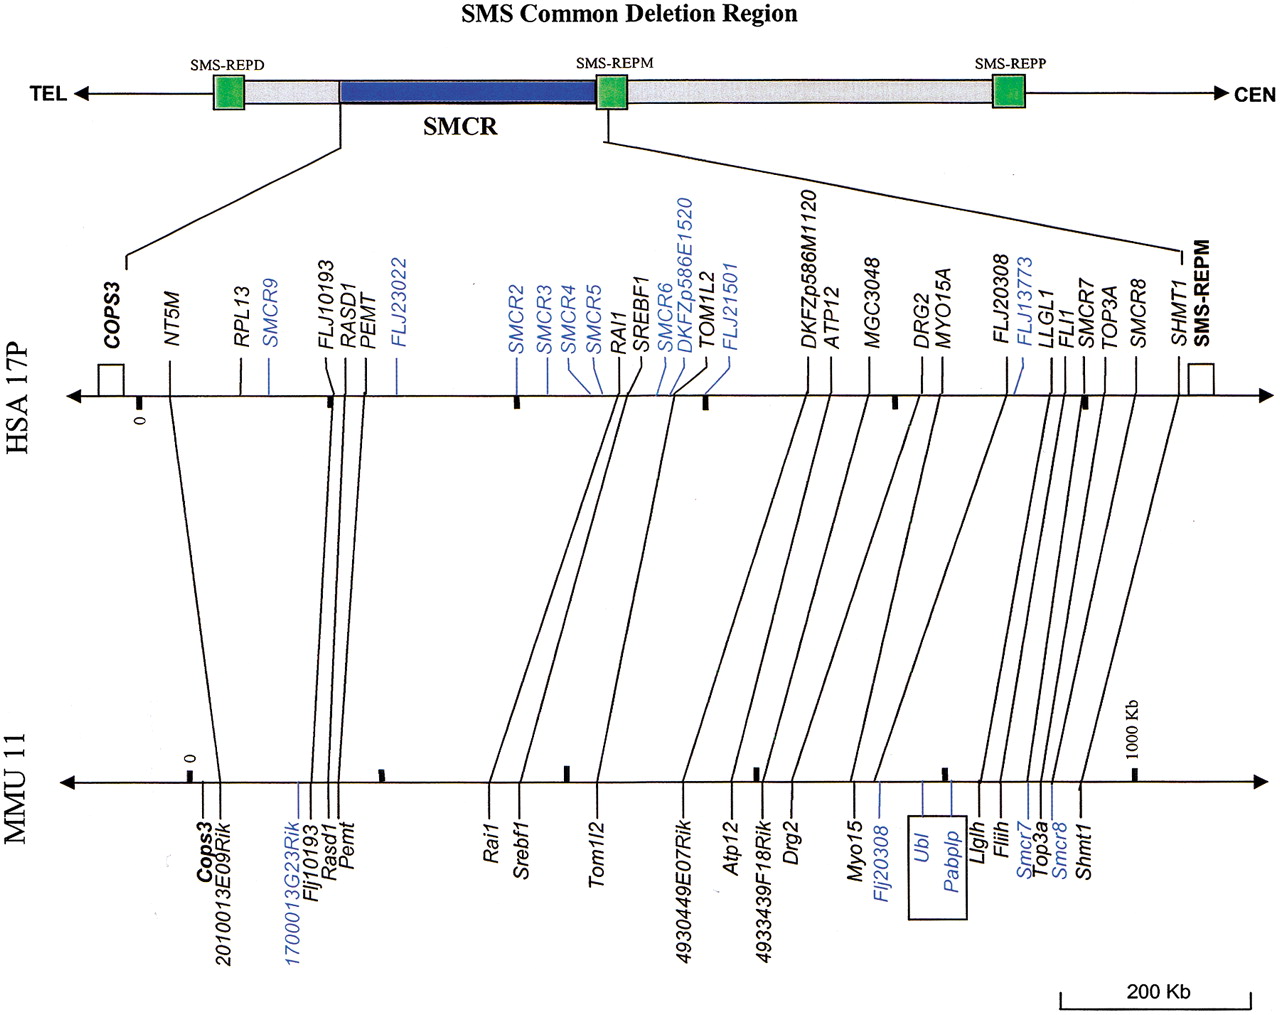
Figure 5.
Comparison of the order of the putative genes in the SMCR and the mouse syntenic region. The open boxes represent the flanking sequences of the SMCR: COPS3 and the middle SMS-REP. Genes are in black, and predicted genes are in blue. Genes in the SMCR are connected with their mouse homologs by lines. The region that contains two mouse gene clusters that are not inside the SMCR is boxed. The location of the SMCR in the common deletion region is indicated at the top.


