
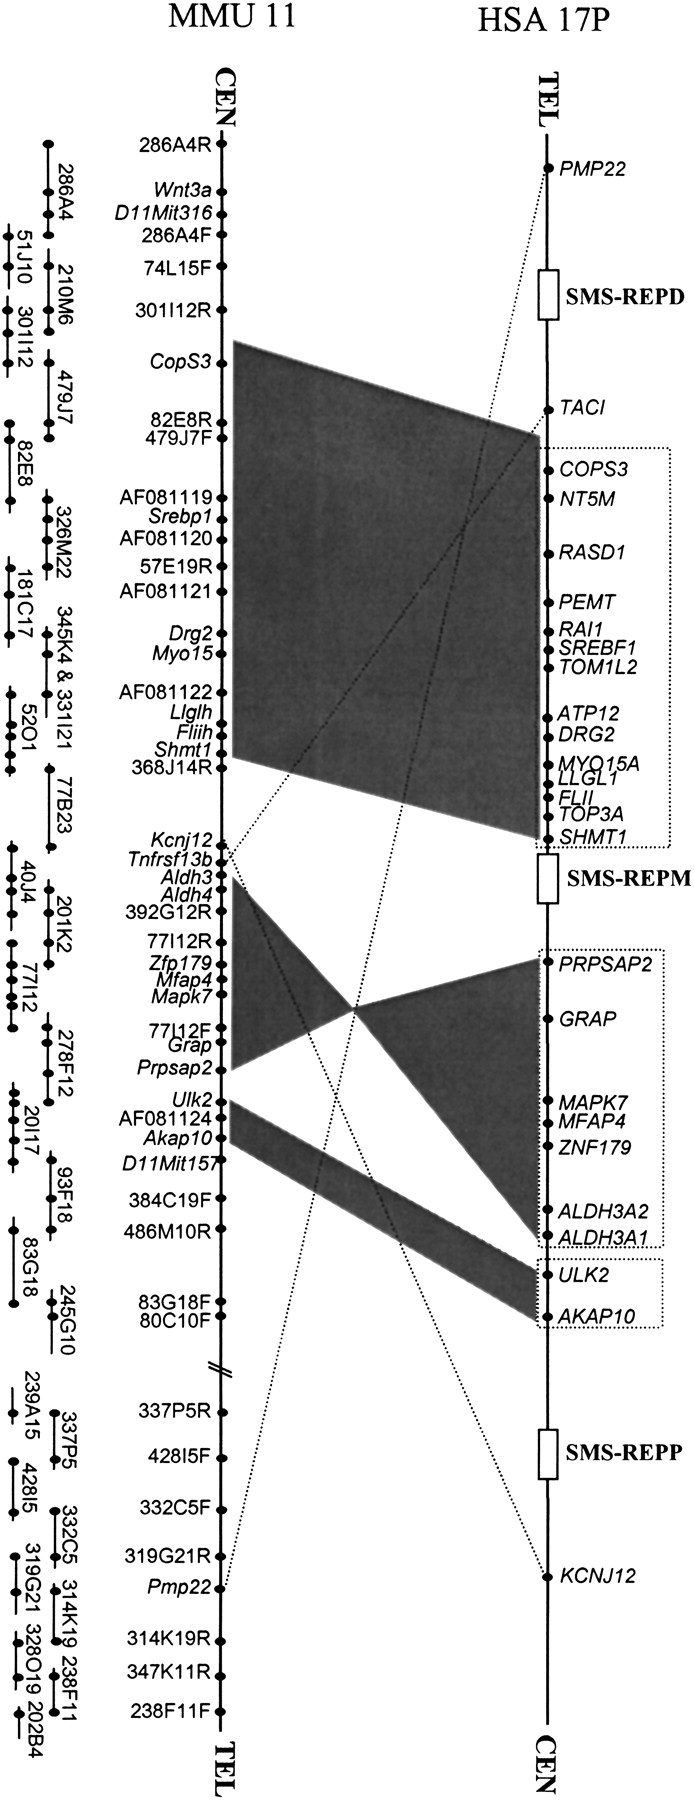
Figure 2.
Comparison of the gene order in the human SMS common deletion region and its mouse syntenic region. Genes within the human SMS region on 17p11.2 are shown above. Open boxes represent the SMS-REPs. Below is shown the minimum BAC tiling path of the mouse syntenic region of the SMS common deletion interval and its flanking region. Each BAC clone is represented by a horizontal bar with STS-content markers represented by dots. Blocks of genes that show linkage conservation (i.e., identical gene order) in humans and mice are boxed and connected via gray shading.


