
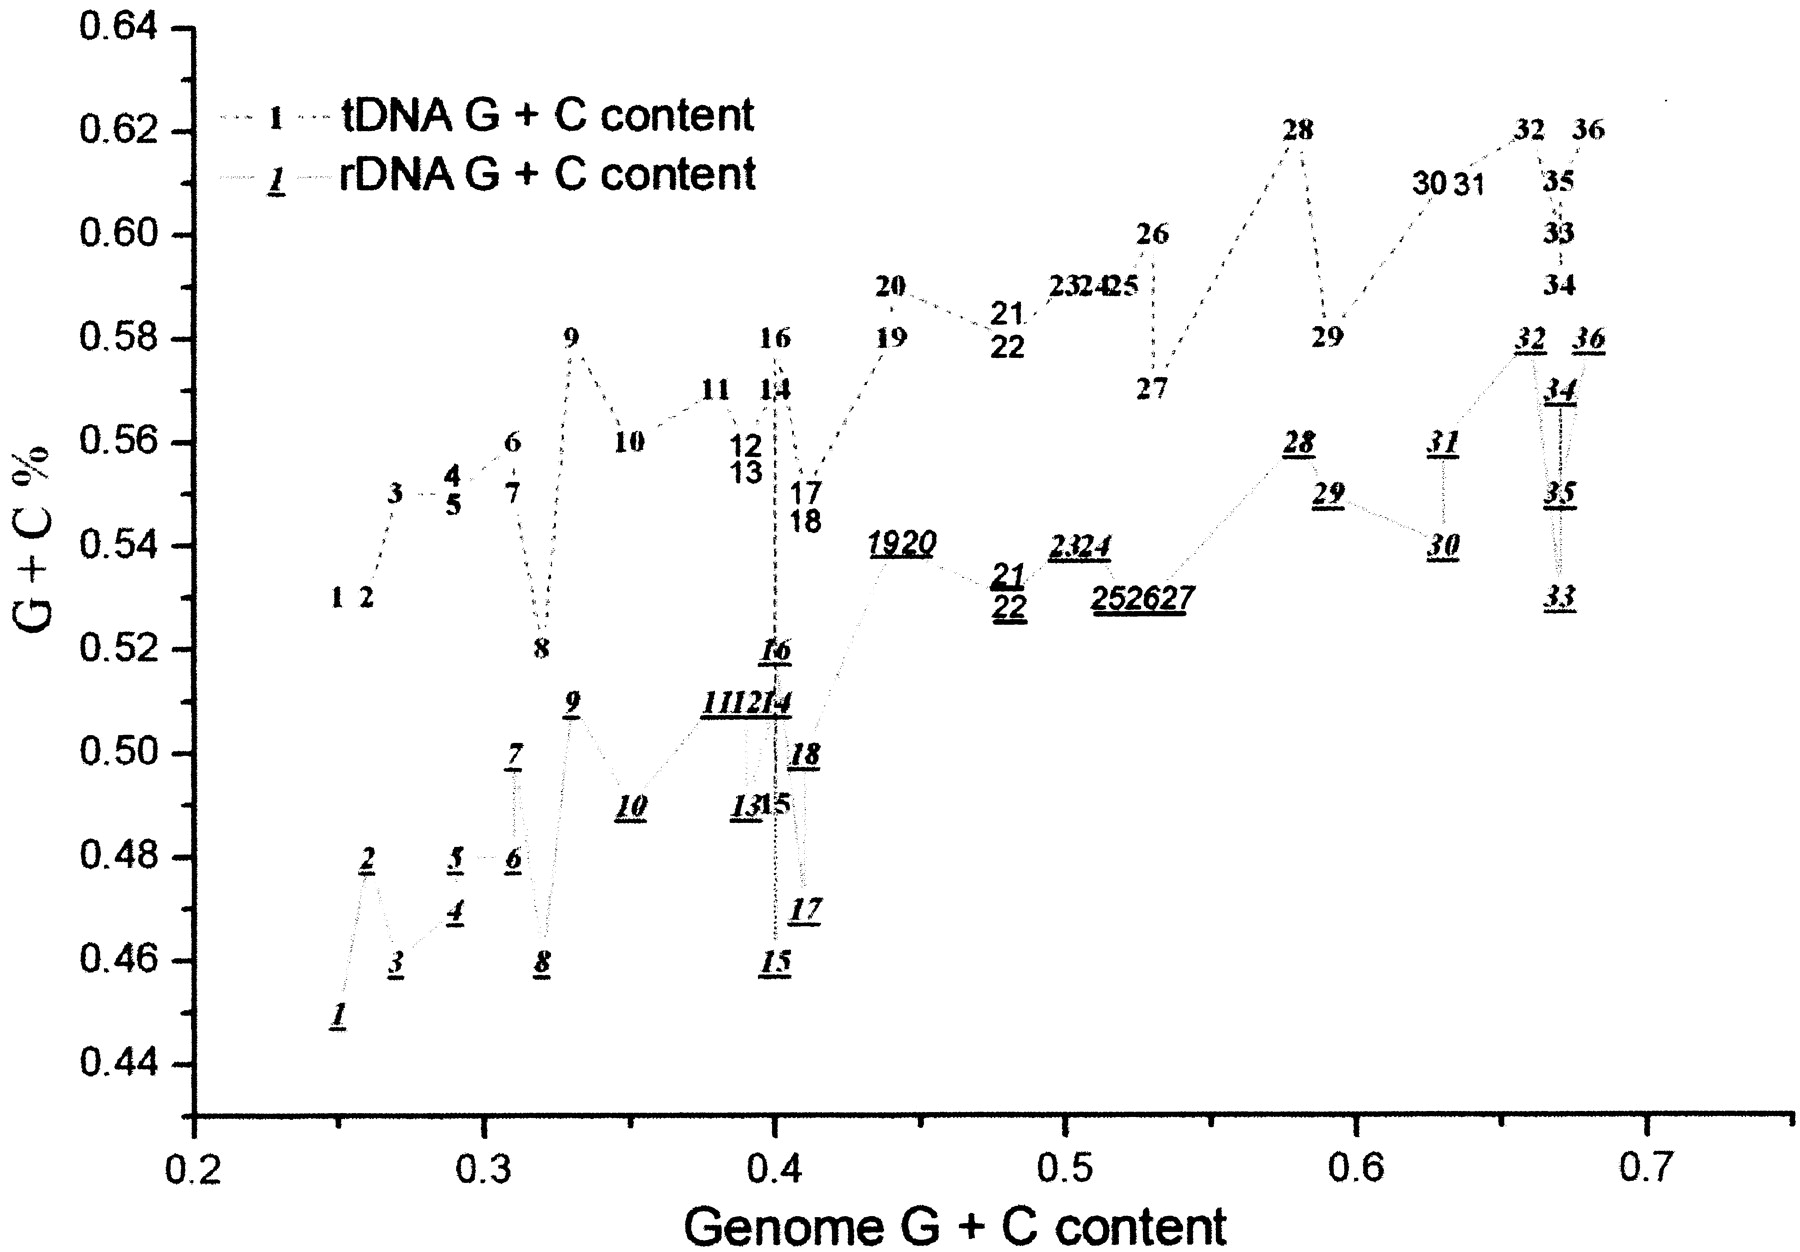
Correlation of G + C contents between the genome average and rDNA/tDNA clusters from 36 mesophiles. G + C contents of tDNA and rDNA (underlined) show significant correlation with genome G + C contents (linear regression coefficients R = 0.88 and R = 0.8, respectively). Numbers in the figure stand for the sequenced prokaryotes: 1, Uure; 2, Buch; 3, Mpul; 4, Bbur; 5, Rpxx; 6, Cjej; 7, Cace; 8, Mgen; 9, SaurN; 10, Llact; 11, Hinf; 12, Spyo; 13, Hpyl; 14, Spneu; 15, Mpneu; 16, Pmul; 17, Cpneu; 18, Ctra; 19, Bsub; 20, Bhal; 21, Vcho; 22, Synecho; 23, Ecoli_O157; 24, Ecoli; 25, Nmen; 26, Xfas; 27, Tpal; 28, Mlep; 29, Atum; 30, Smel; 31, Mlot; 32, Mtub; 33, Paer; 34, Drad; 35, Ccre; and 36, Hbsp.


