
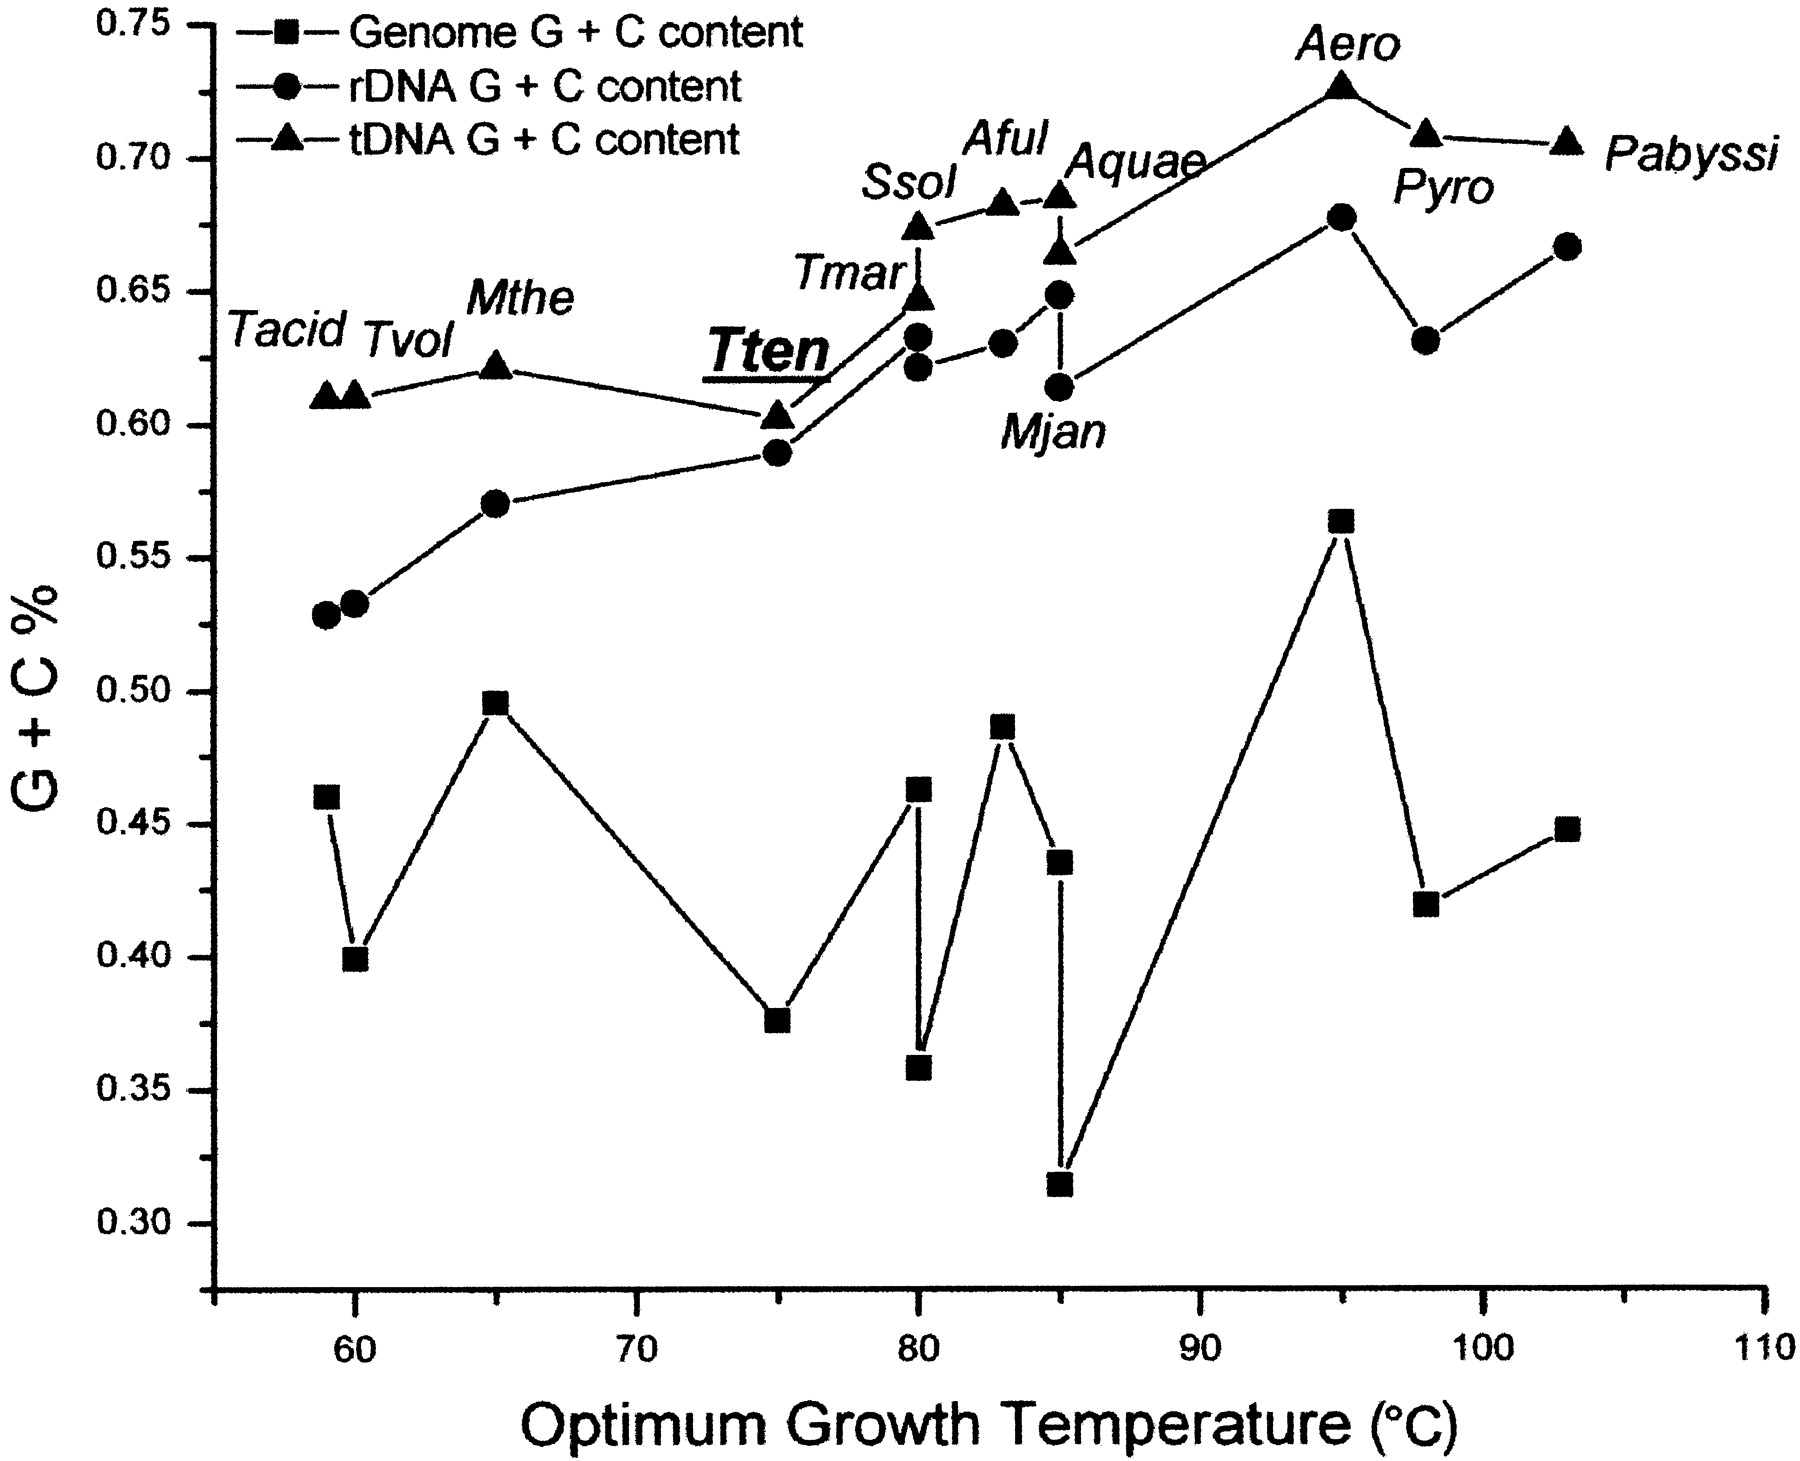
Figure 4.
Correlation of G + C contents and optimum growth temperatures (OGT) of thermophilic bacteria. G + C contents of genomes (solid squares), rDNAs (solid circles), and tDNAs (solid triangles) of 12 thermophilic archaea and eubacteria are plotted against the corresponding OGT. G + C contents of tDNAs and rDNAs show significant correlation with OGTs (linear regression coefficients R = 0.9 andR = 0.92, respectively), but no significant correlation is observed between genomic G + C contents and OGT (R = 0.09).


