
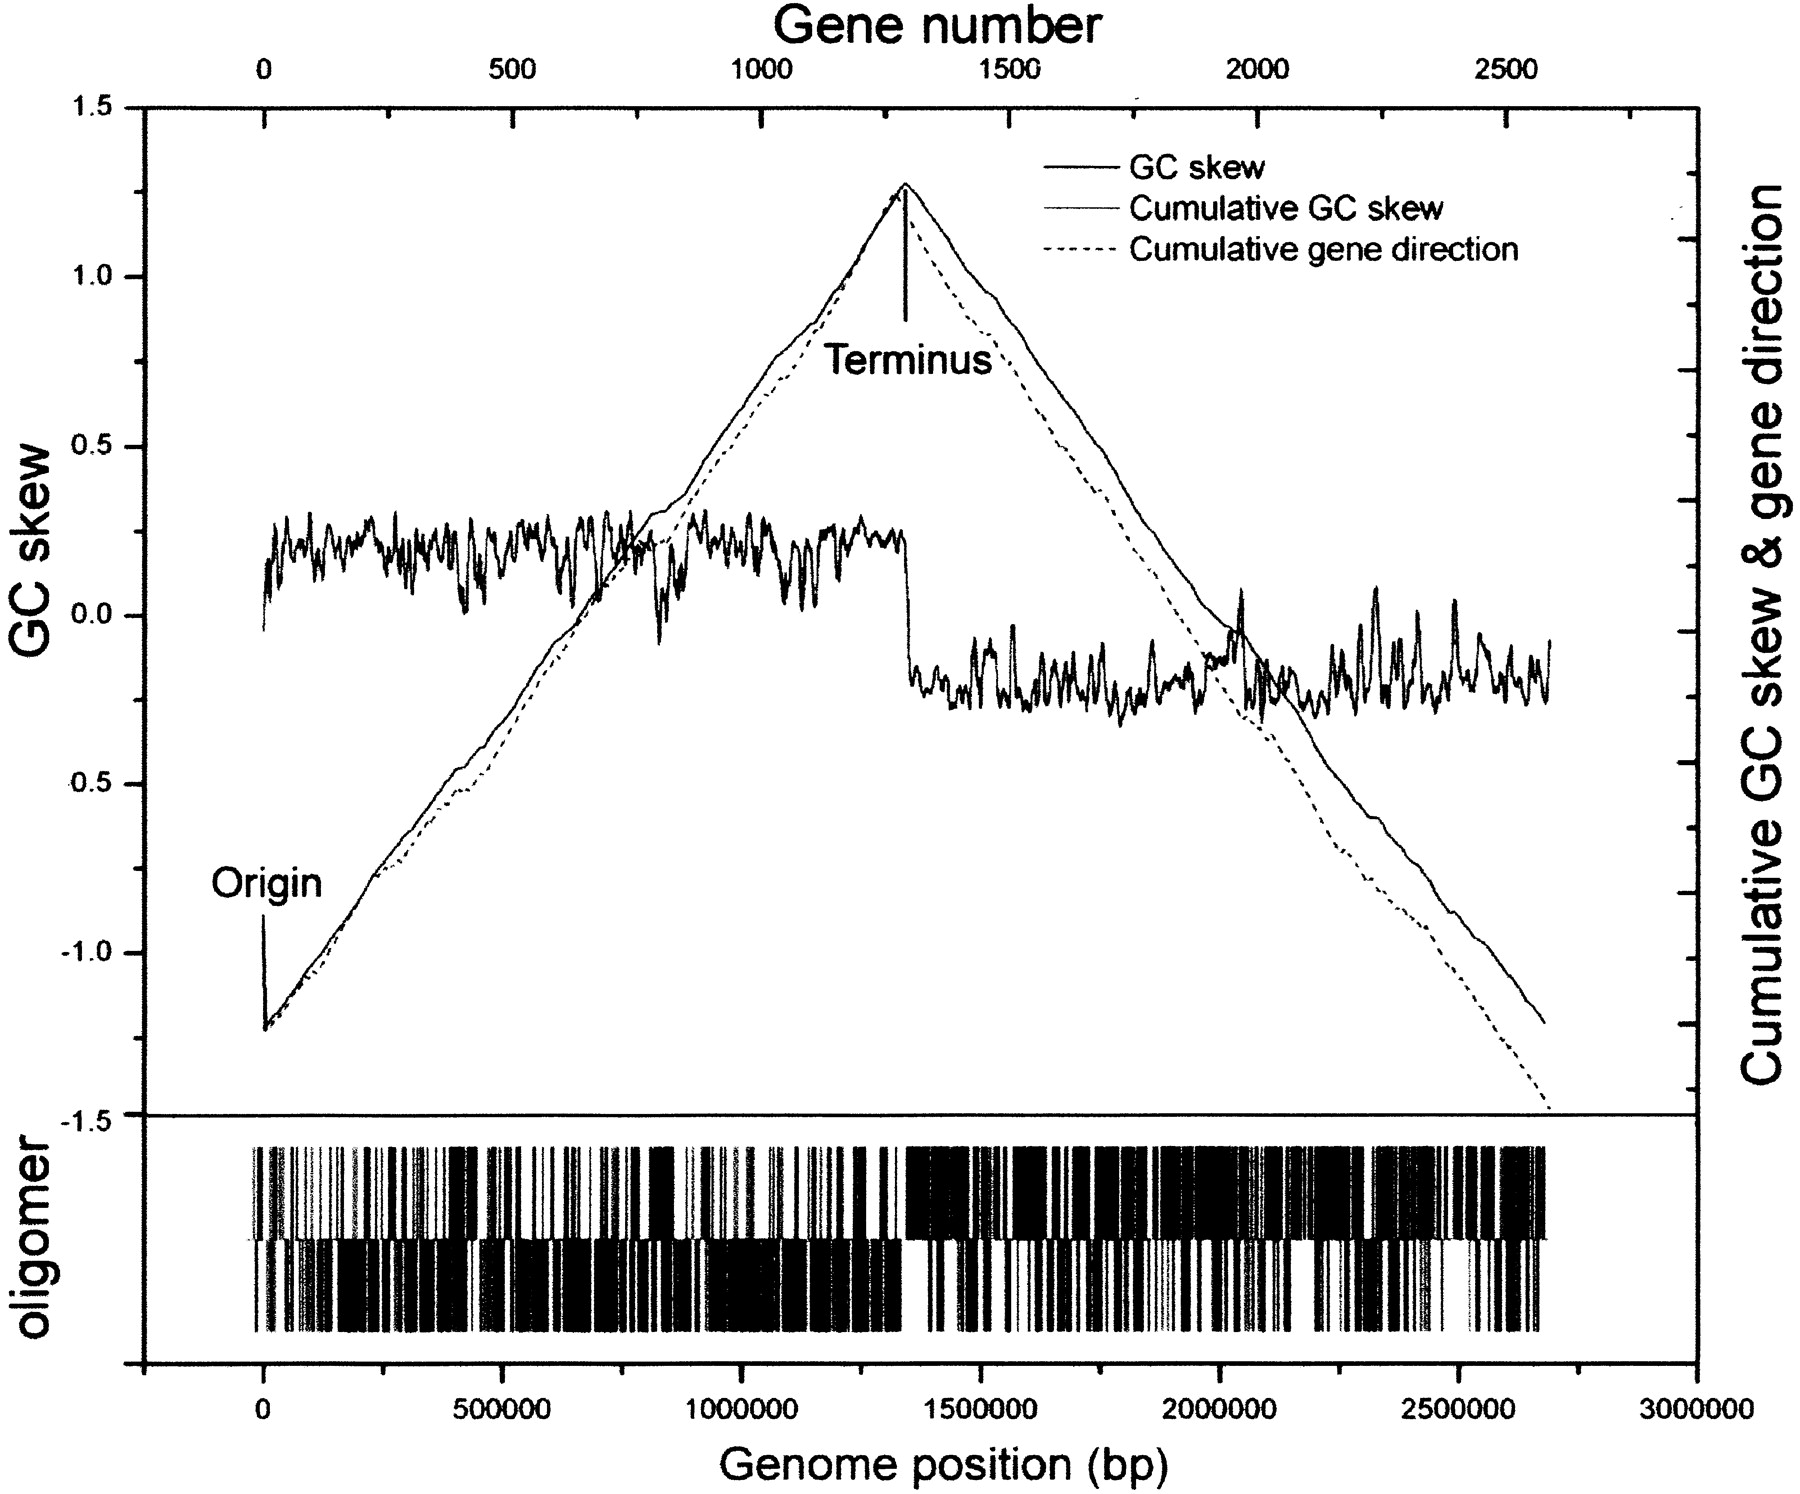
The replication origin of the Thermoanaerobacter tengcongensis. GC skew [(G-C)/(G + C)] was calculated with a nonoverlapping sliding window of 10 kb for a single strand over the length (upper horizontal line). Cumulative GC skew was plotted from position 1 of the genome (upper solid line). Cumulative gene direction (upper dotted line) was plotted from position 1 of the genome sequence, showing that the majority of genes transcribe along the same direction following the replication forks. In the skewed oligomer (TTTTTCTT)1423 part (lower), vertical lines above the center represent the location of this octamer on one DNA strand, and lines below the center indicate the positions on the complementary strand. The transition in GC and oligomer skews, maxima of the curves at the middle of the genome sequence, is identified as the putative terminus of replication.


