
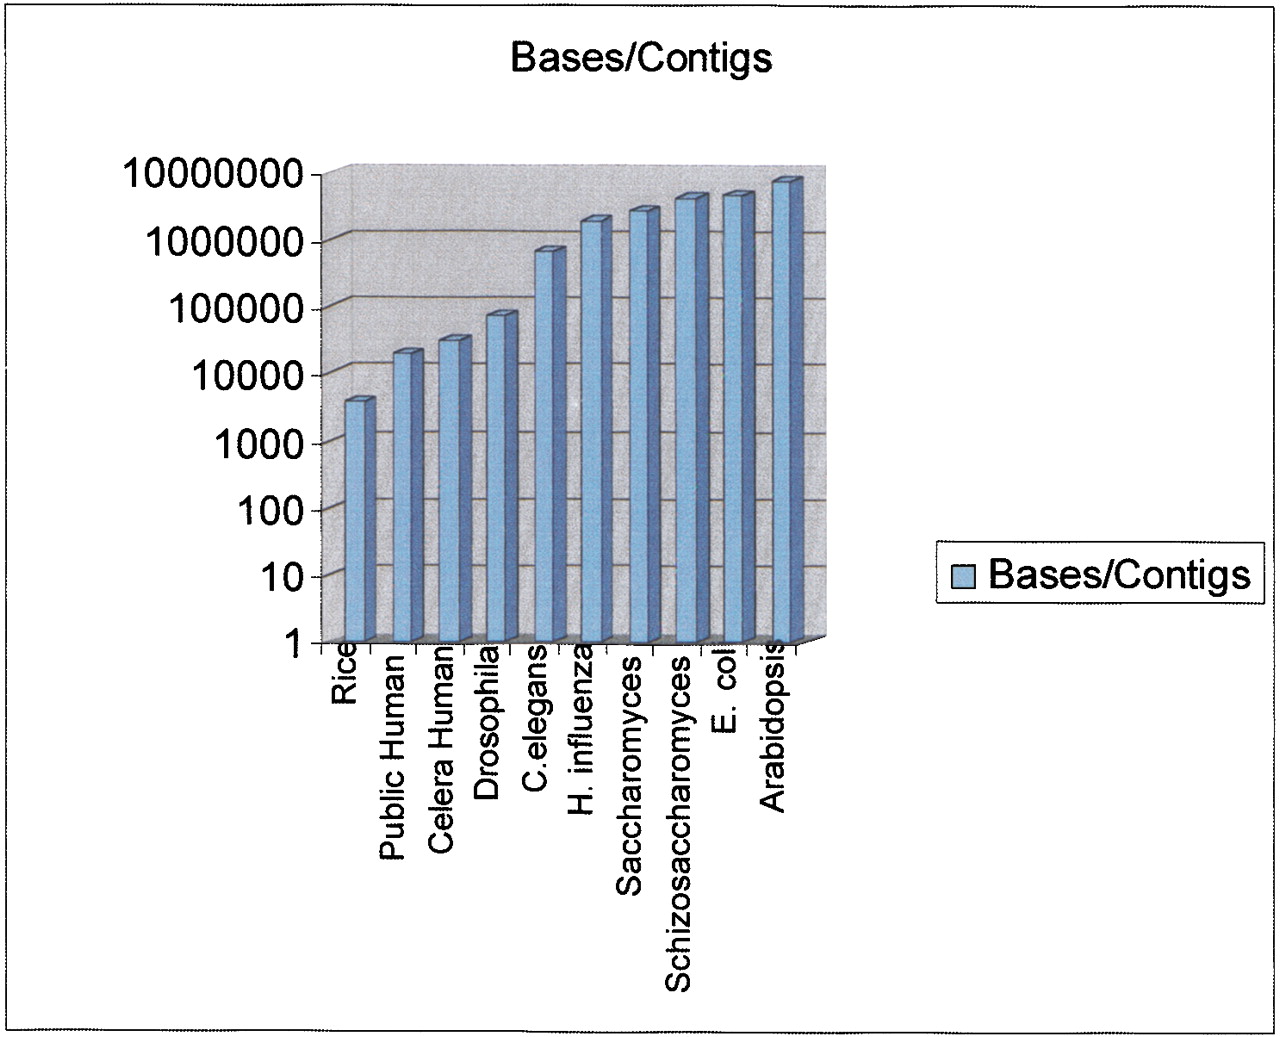
The figure shows the results of dividing the genome size by the number of contigs in the sequence at the time of initial publication. Although other ways to measure contig size are often used, such as N50, they were impossible to estimate on all of these projects. As a result we used this simpler metric, which provides a reasonable estimate of the degree of continuity in the sequence. Genomes represented and the source of the data are: Rice (indica) publicly available draft sequence (Yu et al. 2002); public human genome (Lander et al. 2001); Celera human genome (Venter et al. 2001); Drosophila melanogaster(Adams et al. 2000); Caenorhabditis elegans (The C. elegans Sequencing Consortium 1998); Haemophilus influenzae (Fleischmann et al. 1995); Saccharomyces cerevisiae (Saccharomyces Genome Database,http://genome-www.stanford.edu/Saccharomyces); Schizosaccharomyces pombe (Wood et al.); Escherichia coli (Blattner et al. 1997); and Arabidopsis thaliana (Arabidopsis Genome Initiative 2000).


