
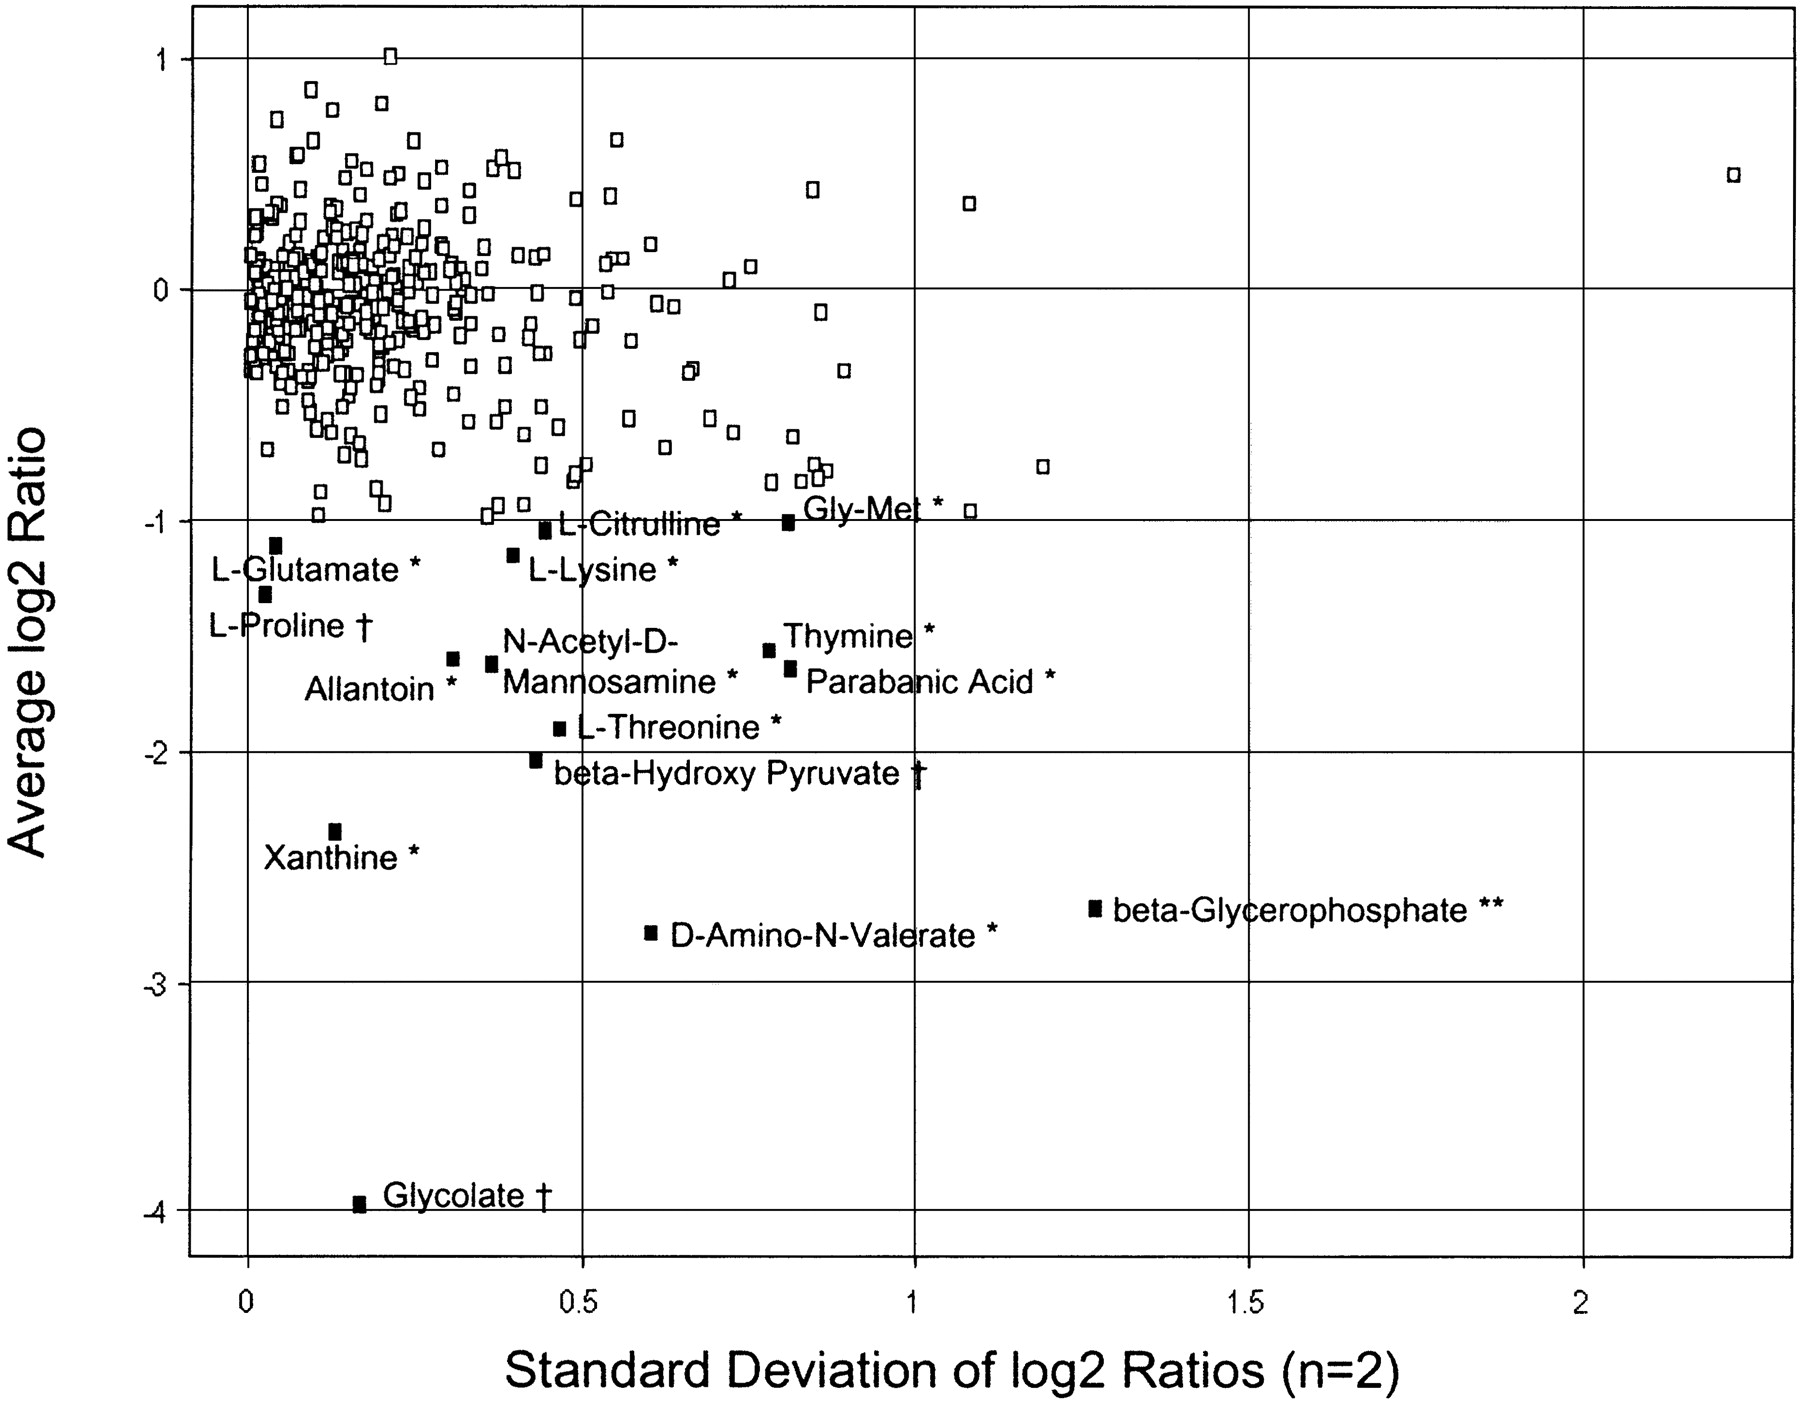
Figure 4.
Biolog Phenotype Microarray analysis. MG1655 and MDS12 were inoculated in parallel into Biolog microtiter plates containing 379 different growth media, and endpoint growth was measured by absorbance. The value for MDS12 was divided by that of MG1655, and the log2 value was calculated. The average of two replicates and the standard deviation are shown. Media on which the mutant grew more than twofold less than weight are indicated, with symbols denoting tests for sources of nitrogen (*), phosphorous (**), and carbon (†).


