
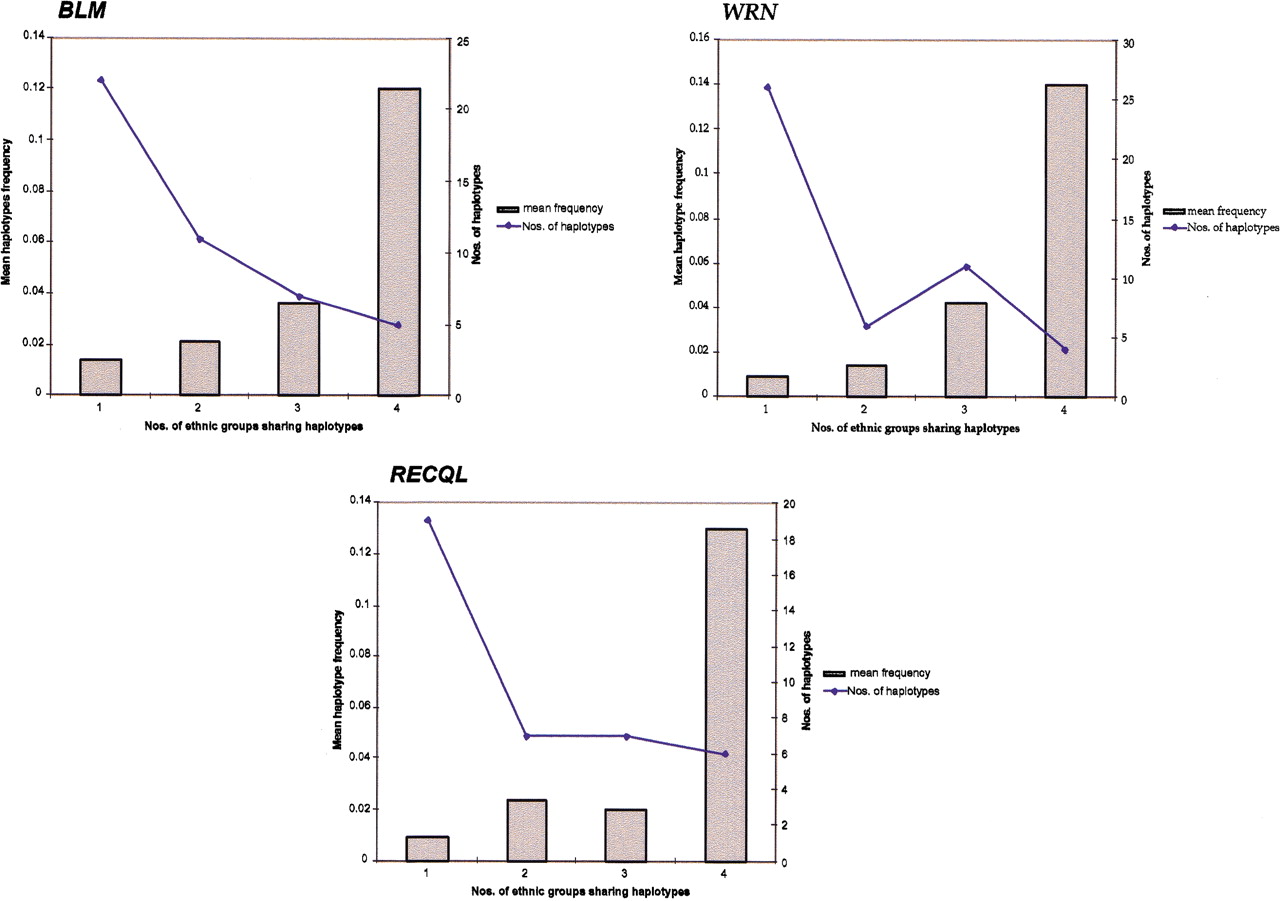
Figure 3.
Ethnic sharing of haplotypes and their frequency for BLM,WRN, and RECQL. Haplotypes and their frequencies are plotted based on whether they are shared between one, two, three, or all four ethnic populations (X-axis). Bars indicate the mean frequencies of haplotypes shared; the line plots the number of haplotypes within each class.


