
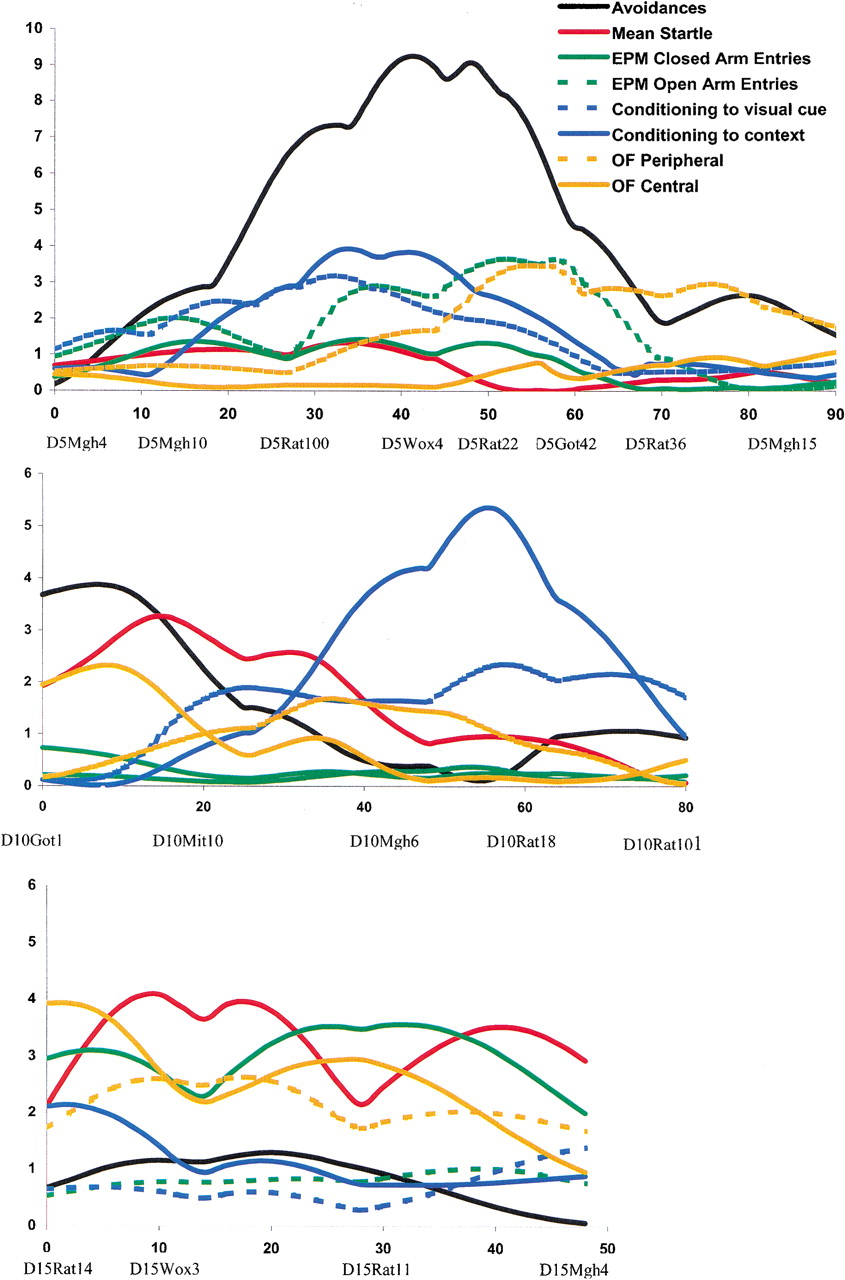
Figure 1.
LOD plots for single measures on chromosomes 5, 10, and 15. The horizontal distance shows the distance along the chromosome in centimorgans (cM) and the markers used in the study are shown.


