
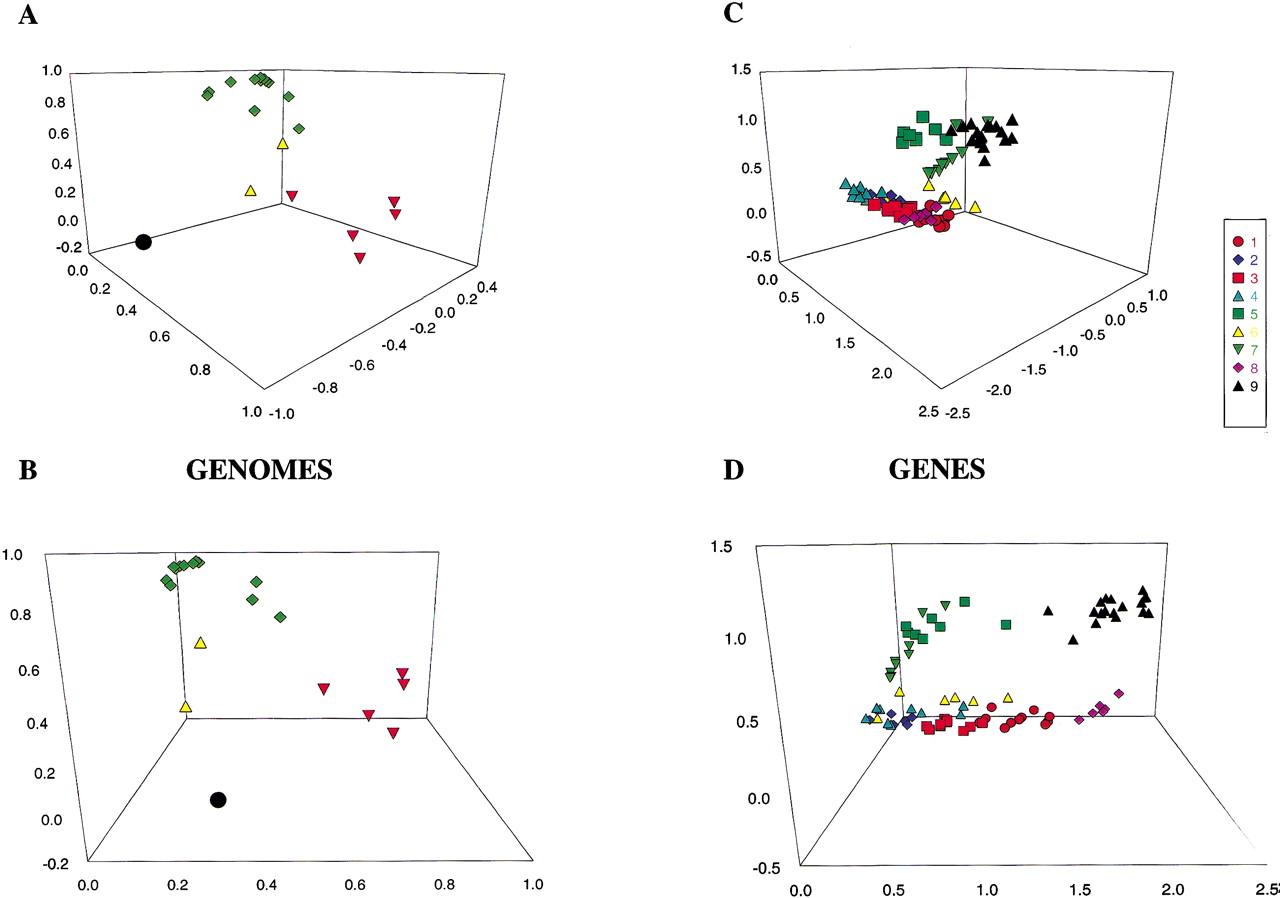
(A) and (B) Projections of the 20 analyzed genomes on the first three factors. Unicellular nongreen algae are shown in red triangles. Green algae and superior plants are in green diamonds. Parasite chloroplasts are in yellow triangles. Cyanobacteria is in solid circles. (C) and (D) Projections of the nine clusters of 20 analyzed genome orthologous groups. The same approximate view of A (in C) and B (in D) is used for comparison. Each cluster is shown with a color-symbol pair: 1, red circles; 2, blue diamonds; 3, red squares; 4, light blue triangles; 5, green squares; 6, yellow triangles; 7, green inverted triangles; 8, purple diamonds; 9, black triangles.


