
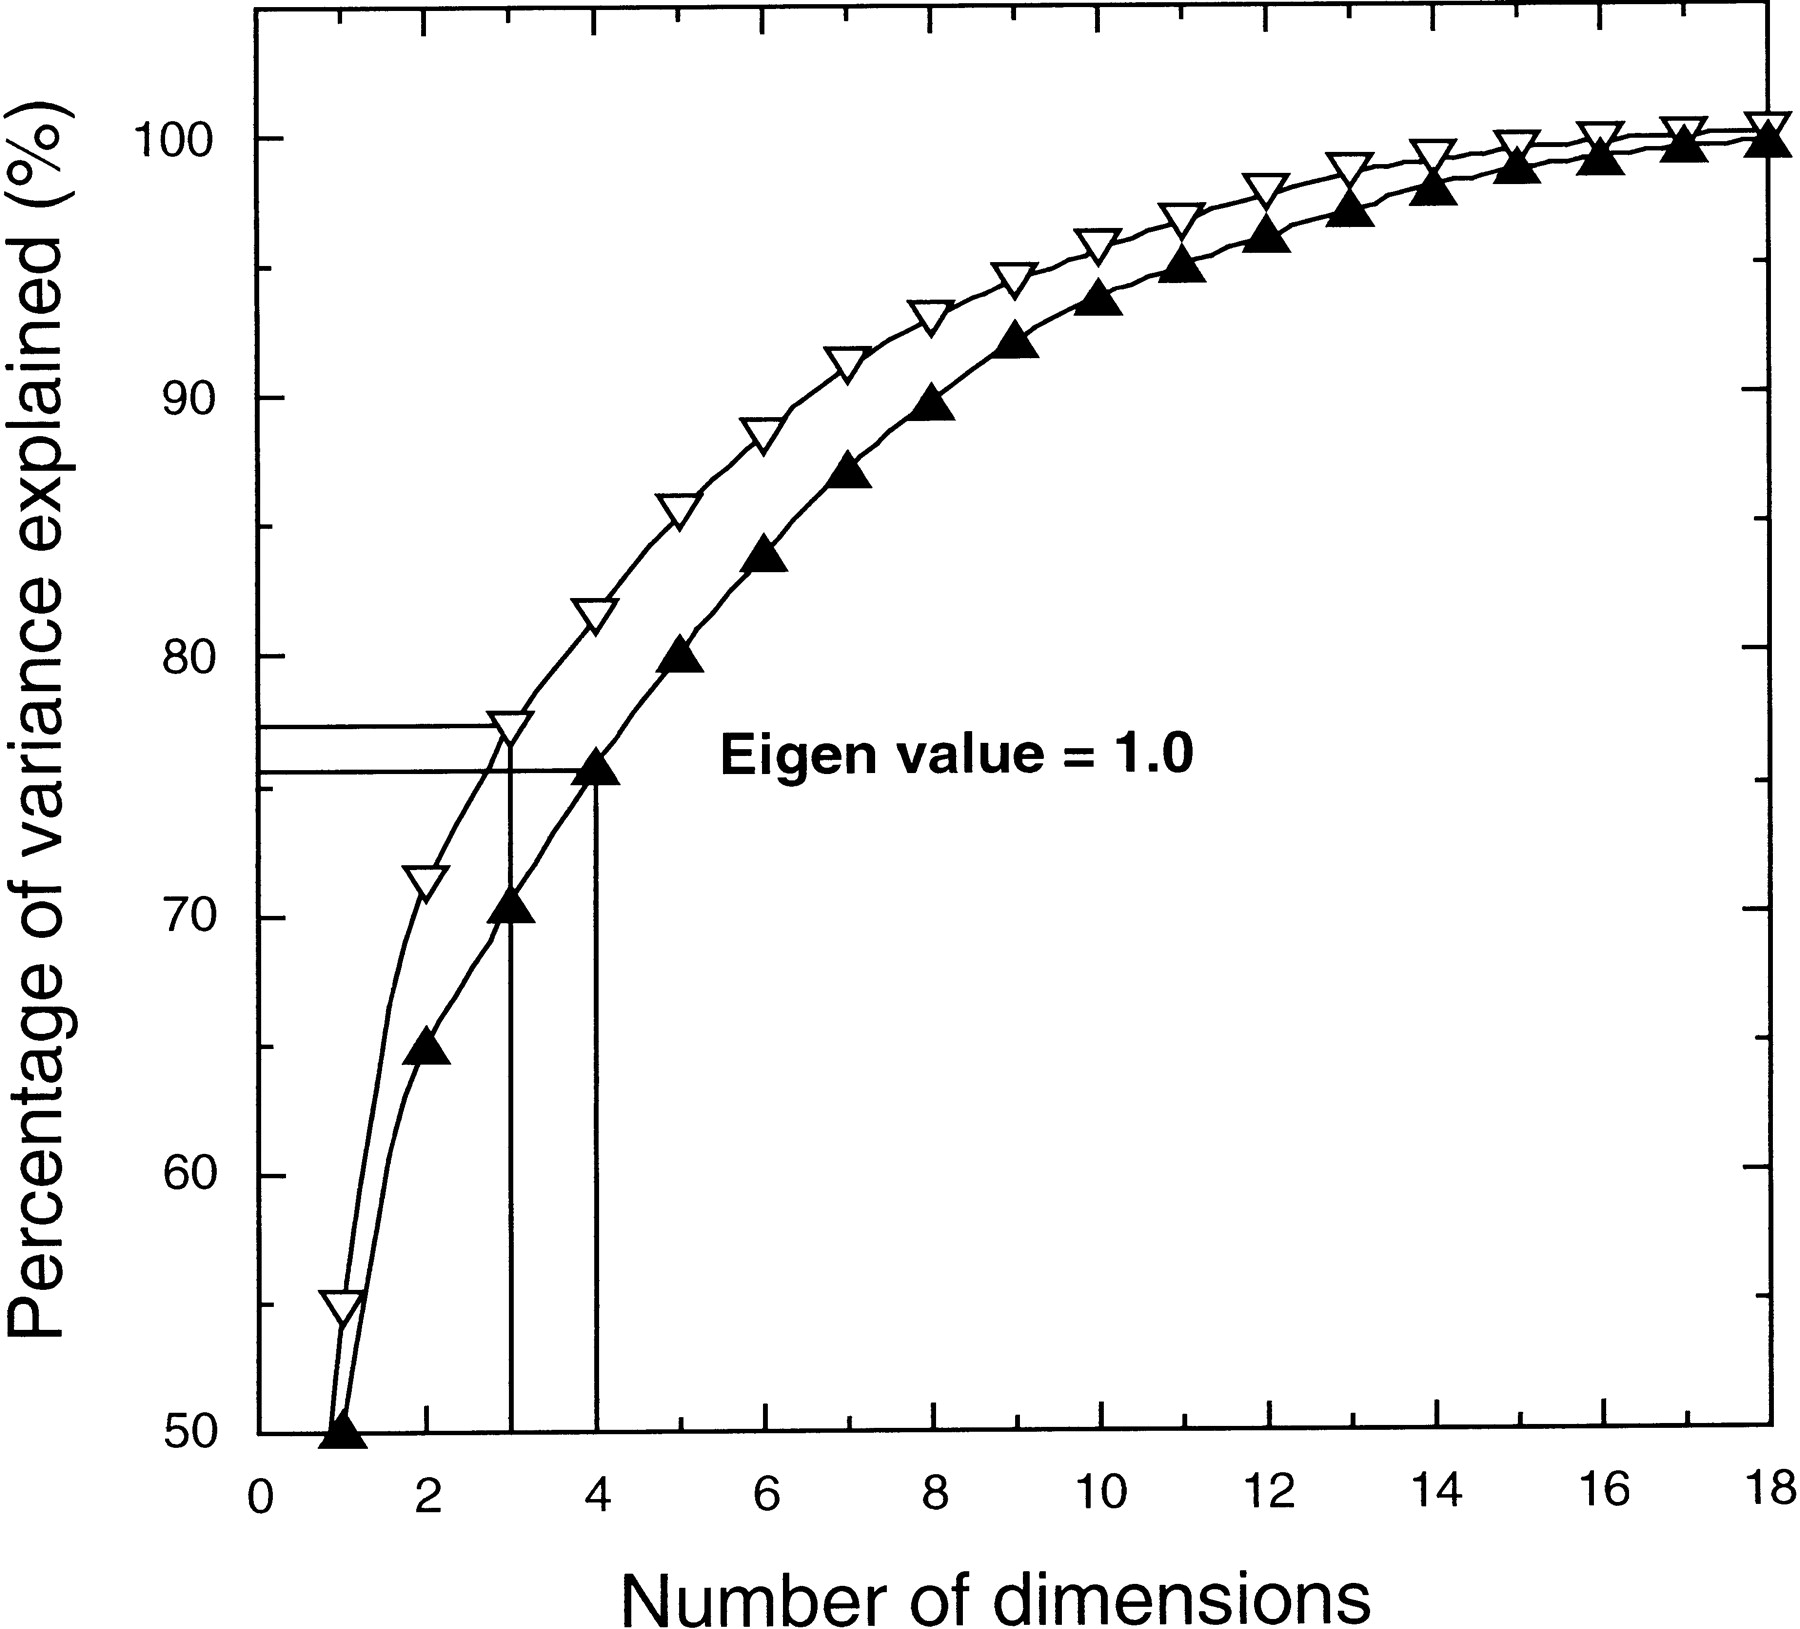
Figure 2.
Accumulated percentage of variance explained at each dimensionality, as obtained by the factorial analyses of the X-matrices. The matrices include 277 groups of orthologous proteins from 20 genomes (solid triangles) or 18 genomes (open triangles).


