
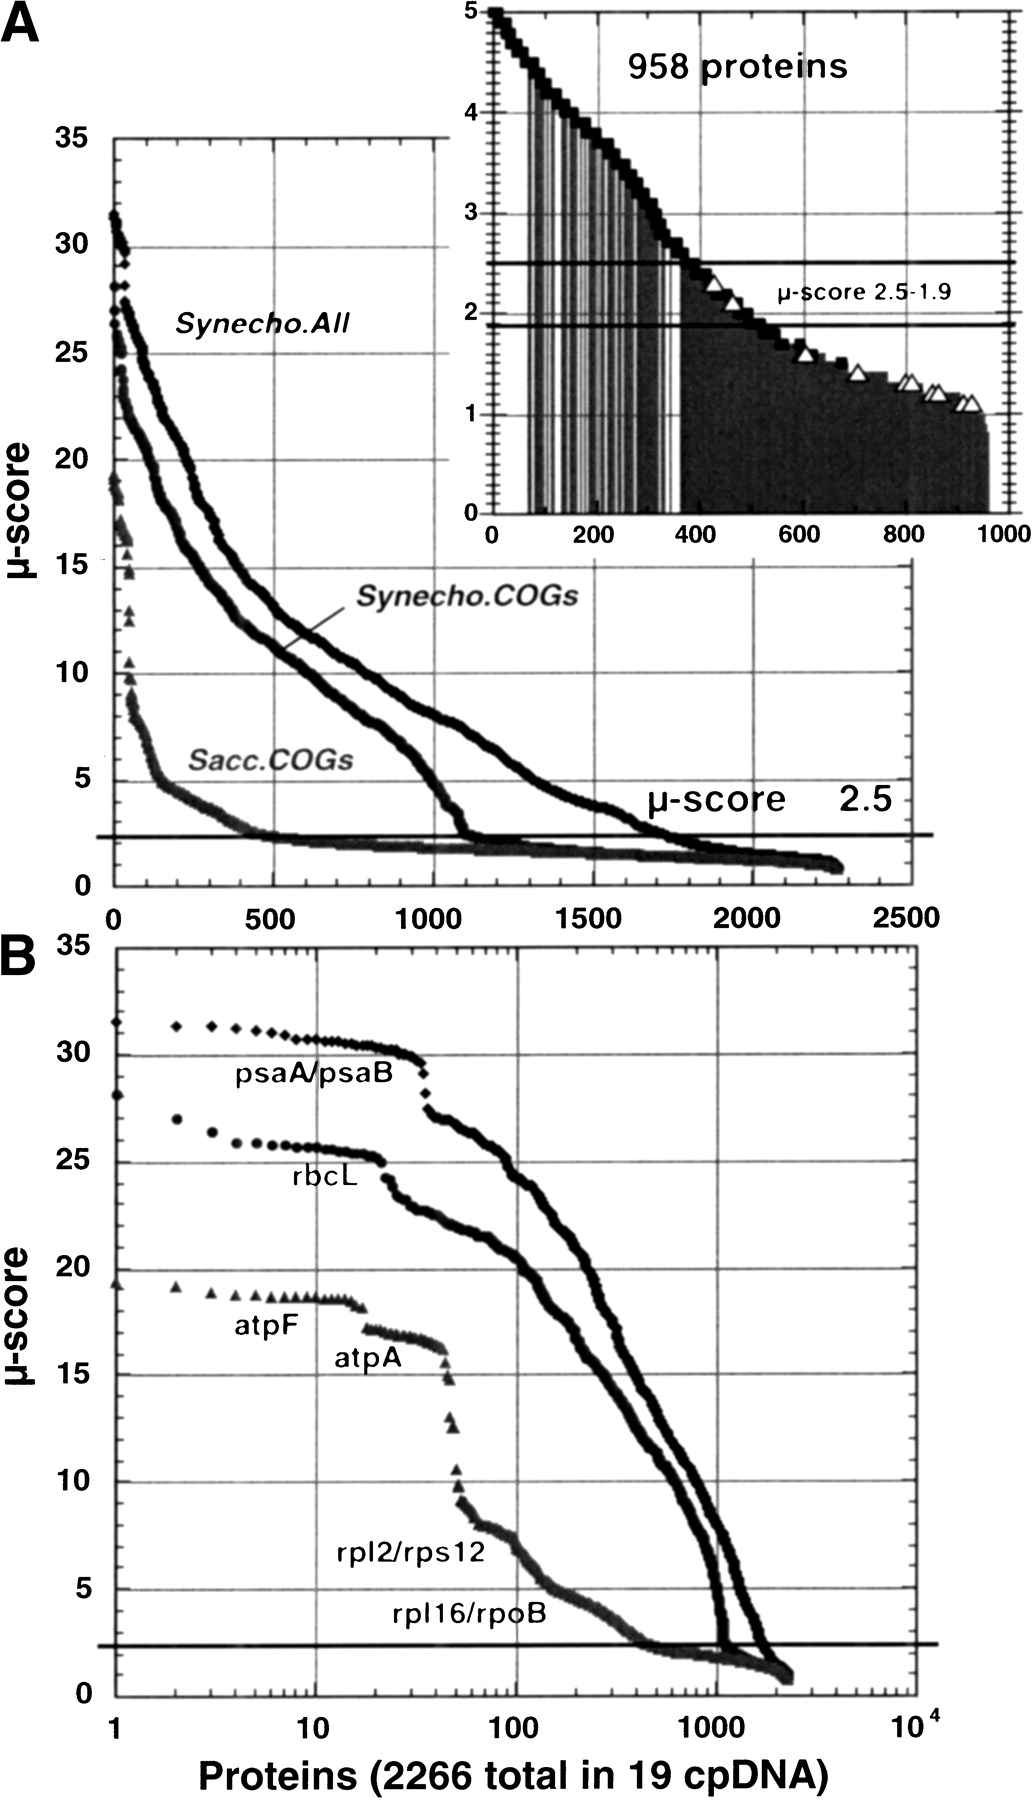
Figure 1.
Plot of the μ-scores obtained by pairwise comparison of all proteins of each cpDNA (a total of 2266 proteins) against the complete predicted proteome of Synechocystis (3168 proteins), against the Synechocystis clusters of orthologous proteins (COGs; 2113 proteins) and against Saccharocyces cerevisiae (2175 proteins). The figures are plotted in linear (top graph) and in log scale (bottom graph). Inset indicates the correct pairs of proteins (squares) and the incorrect pairs (open triangles) for the data corresponding to comparison with the completeSynechocystis proteome below μ-score 5; gray lines indicate cases in which both proteins are hypothetical.


