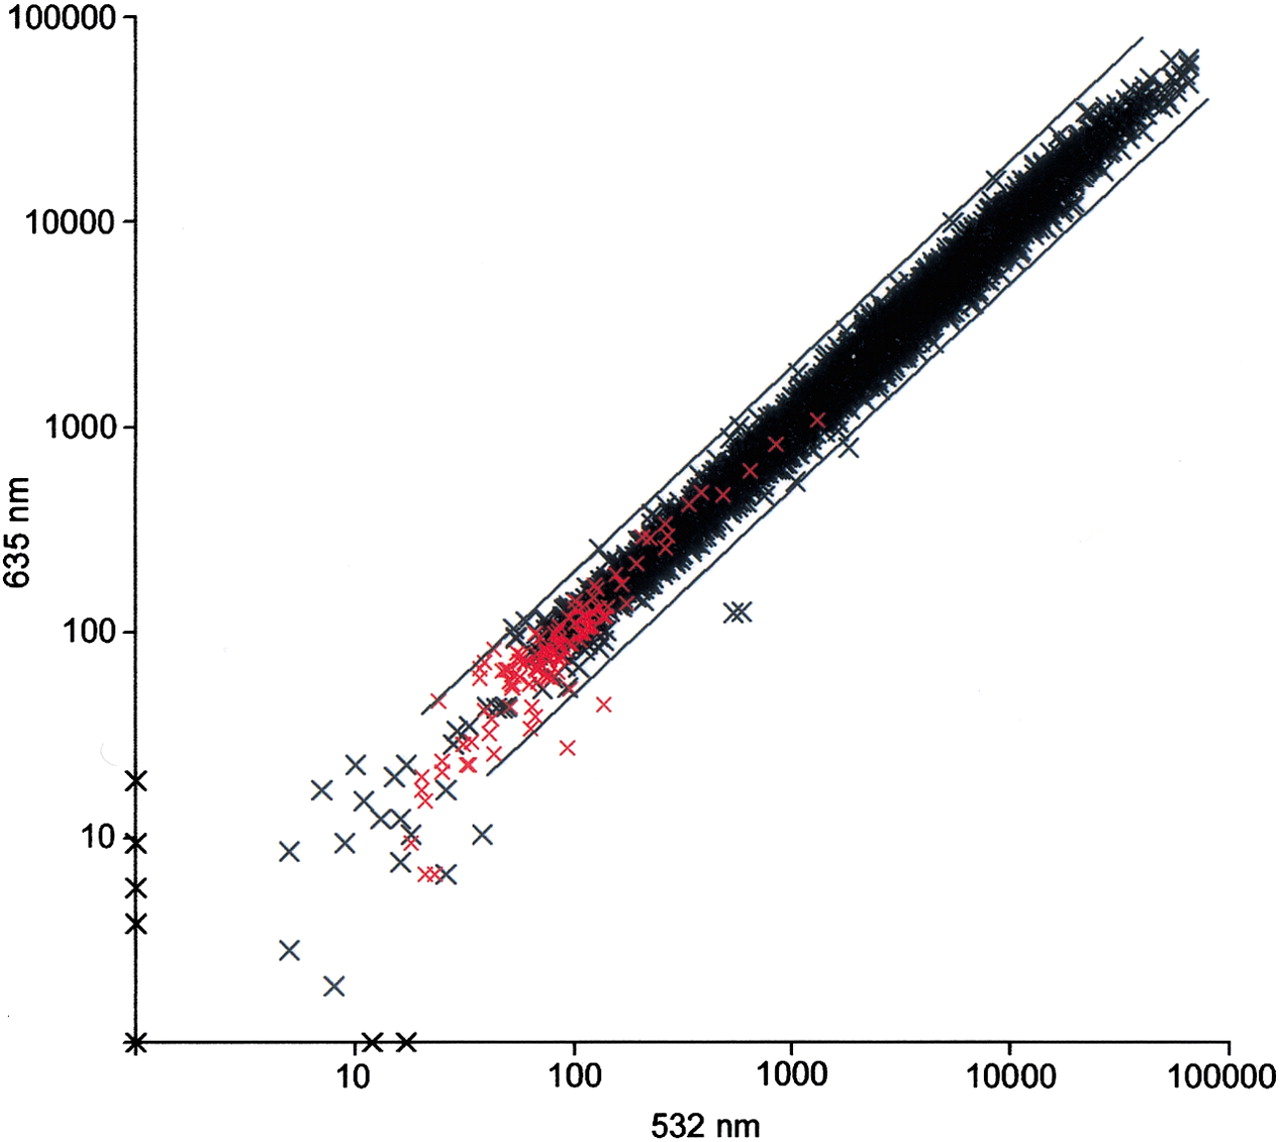
Signal intensities from an example microarray. Values plotted are feature minus background intensity at 635 and 532 nm wavelengths for each cDNA spot (see Methods). Values were normalized such that the median ratio (635:532 nm) equals 1.0. Apis cDNAs are shown as black x's, exogenous negative control cDNAs are shown as red x's. Cy3-labeled probe (532 nm) and Cy5-labeled probe (635 nm) were independently derived from the same starting sample (using in vitro transcription to amplify starting mRNA; see Methods). The starting sample consisted of a mixture of two dissected adult bee brains (one bee observed foraging and one bee observed caring for brood). The coefficient of correlation (r) between 635 and 532 nm values was 0.9926 (based on log-transformed values). Divergence of values from the diagonal (ratio = 1) reflects technical variation introduced during RNA isolation, mRNA amplification by in vitro transcription, and fluorescent labeling of probe. The two diagonal bars indicate ratios (635:532 nm) equal to 0.5 and 2.0.


