
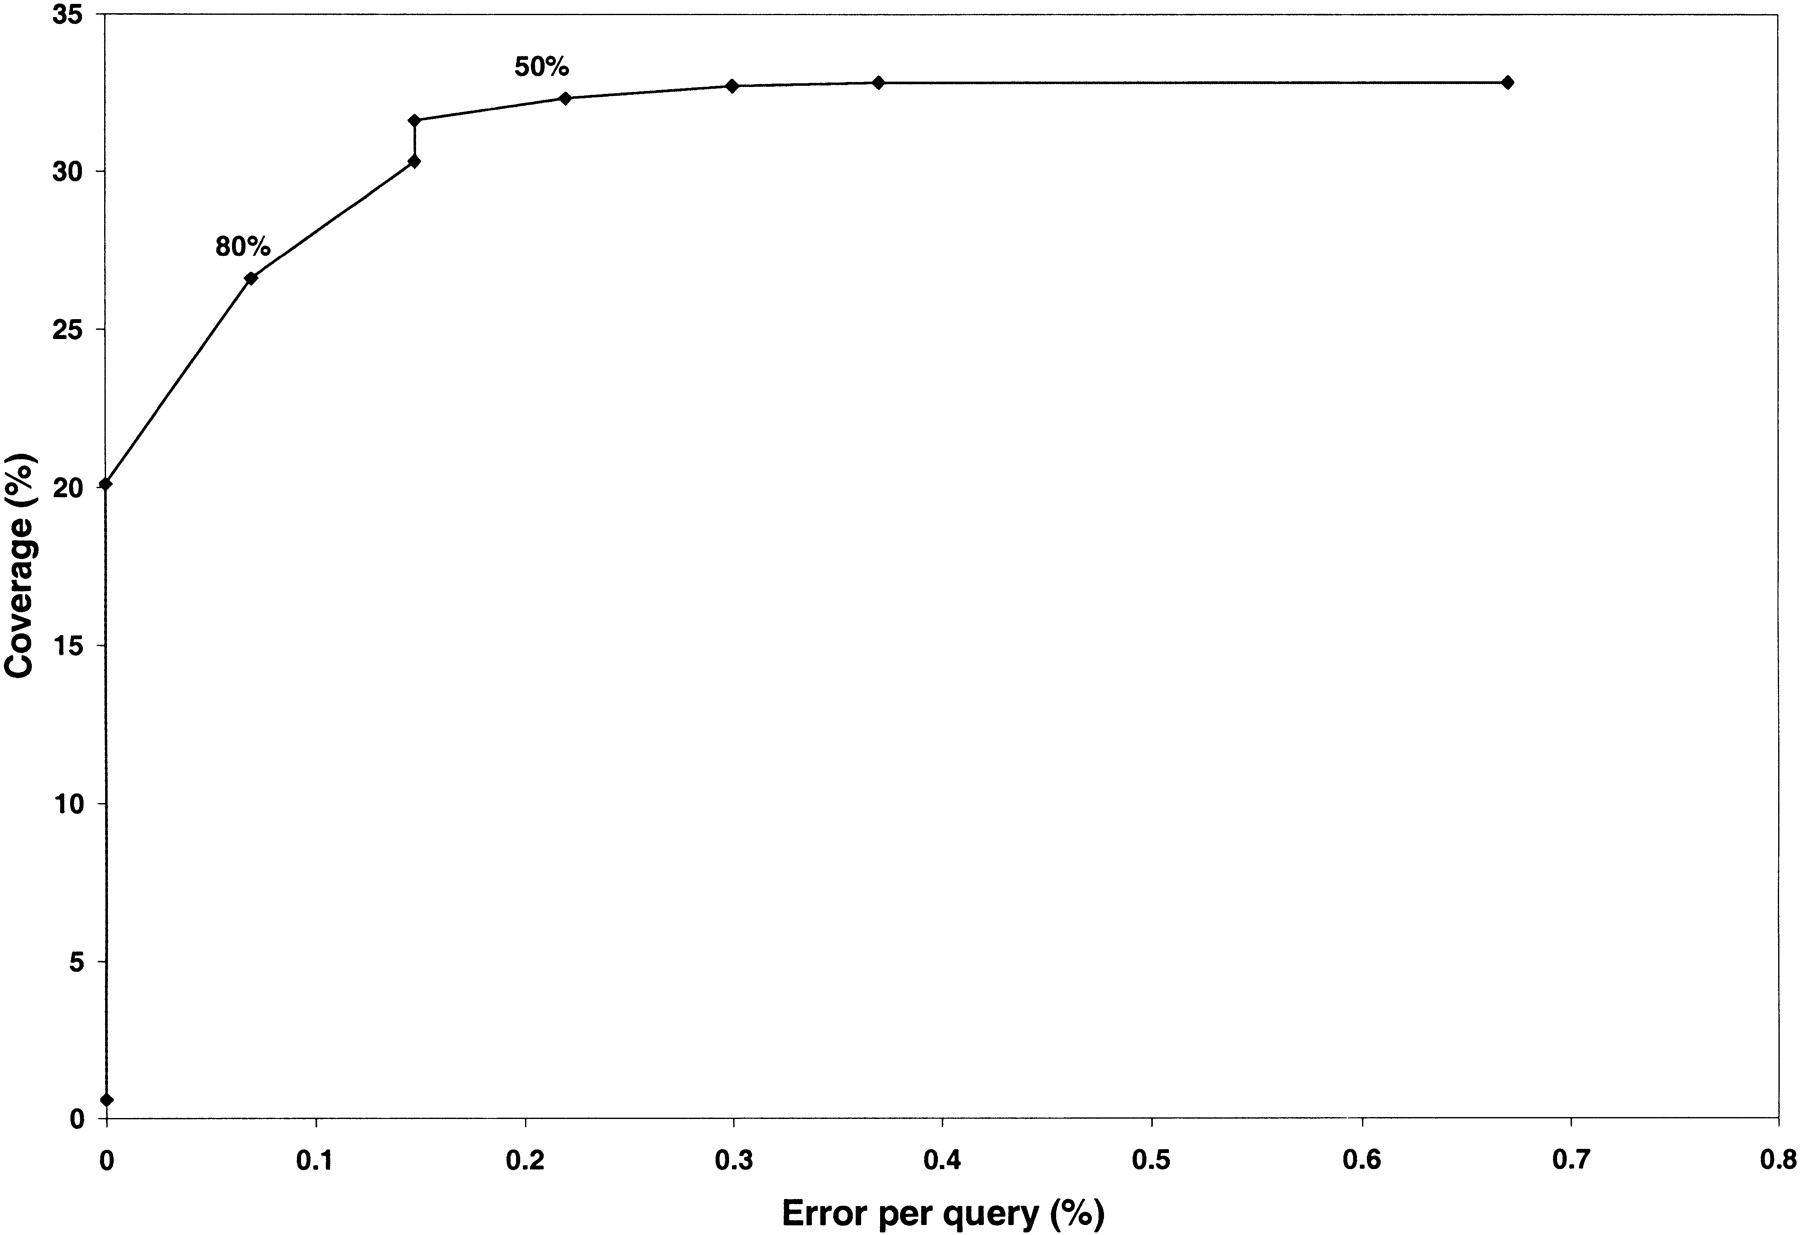
Figure 5.
Error per query (%) by Coverage (%) obtained for one-to-one relationships. The coverage is measured using the CATH-35 sequences. This graph shows the percent coverage of true positives divided by the total number of possible assignments against the numbers of errors per query. These values are plotted for the differing percentages of the query domain (Q) in the alignment.


