
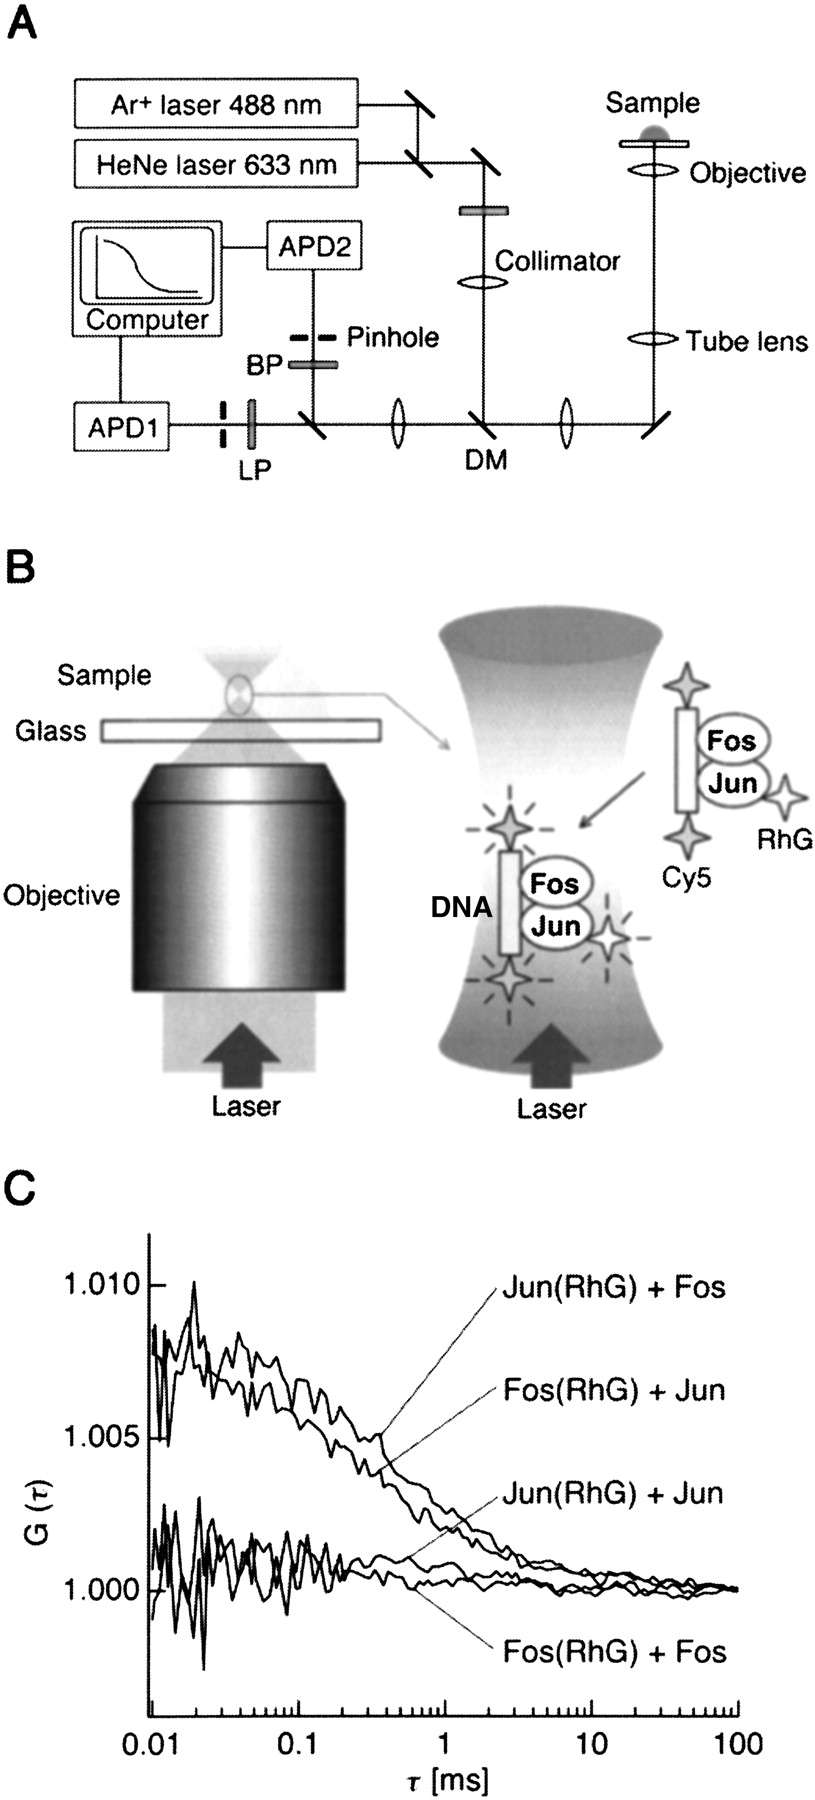
FCCS setup and measured cross-correlation curves. (A) The beampath of the ConfoCor 2 FCCS setup. A sample droplet is excited with two-color laser beams through the objective lens. The emission light is divided and detected by two avalanche photodiodes (APD1 and APD2), and the signals are analyzed by a computer with a correlator. DM, dichroic mirror 488/633 nm; BP, bandpass filter 530–600 nm; LP, longpass filter 650 nm. (B) Schematic diagram of FCCS detection apparatus. (Left) Laser beams are focused in the sample droplet on the coverglass. (Right) In the superimposed confocal volume, RhG-labeled proteins and Cy5-labeled DNA are simultaneously excited. (C) Typical cross-correlation curves obtained from samples of DNA–protein complexes. Fos–Jun heterodimers were bound to Cy5-labeled DNA (top curves), whereas no or little formation of the Fos–Fos–DNA or Jun–Jun–DNA complexes was observed (bottomcurves).


