
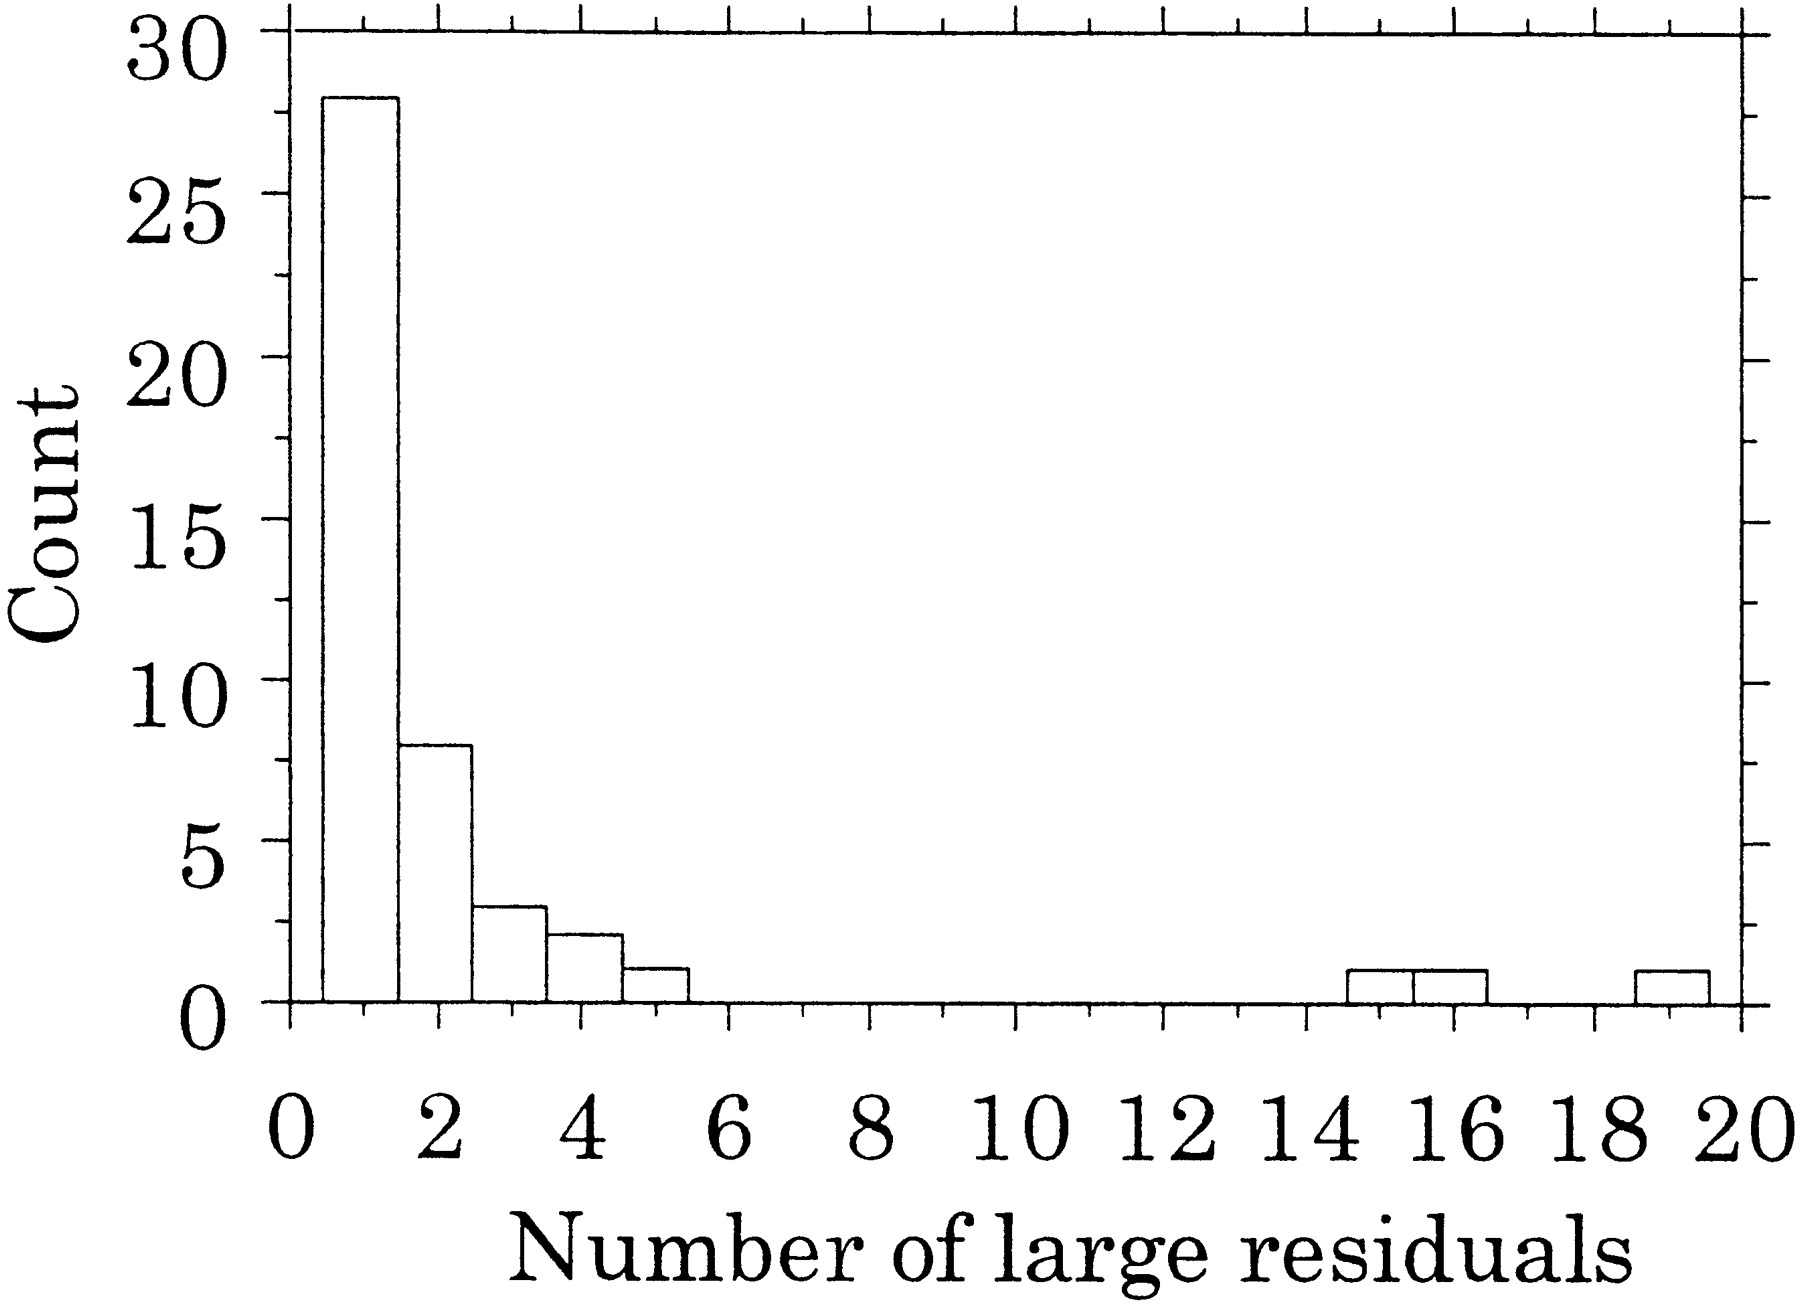
Figure 2.
Histogram of the number of large residuals per marker among 45 non-one-to-one markers. The height of each bar indicates the number of markers with the given number of large residuals (e.g., the short bar at the right indicates that there is one marker with 19 large residuals).


