
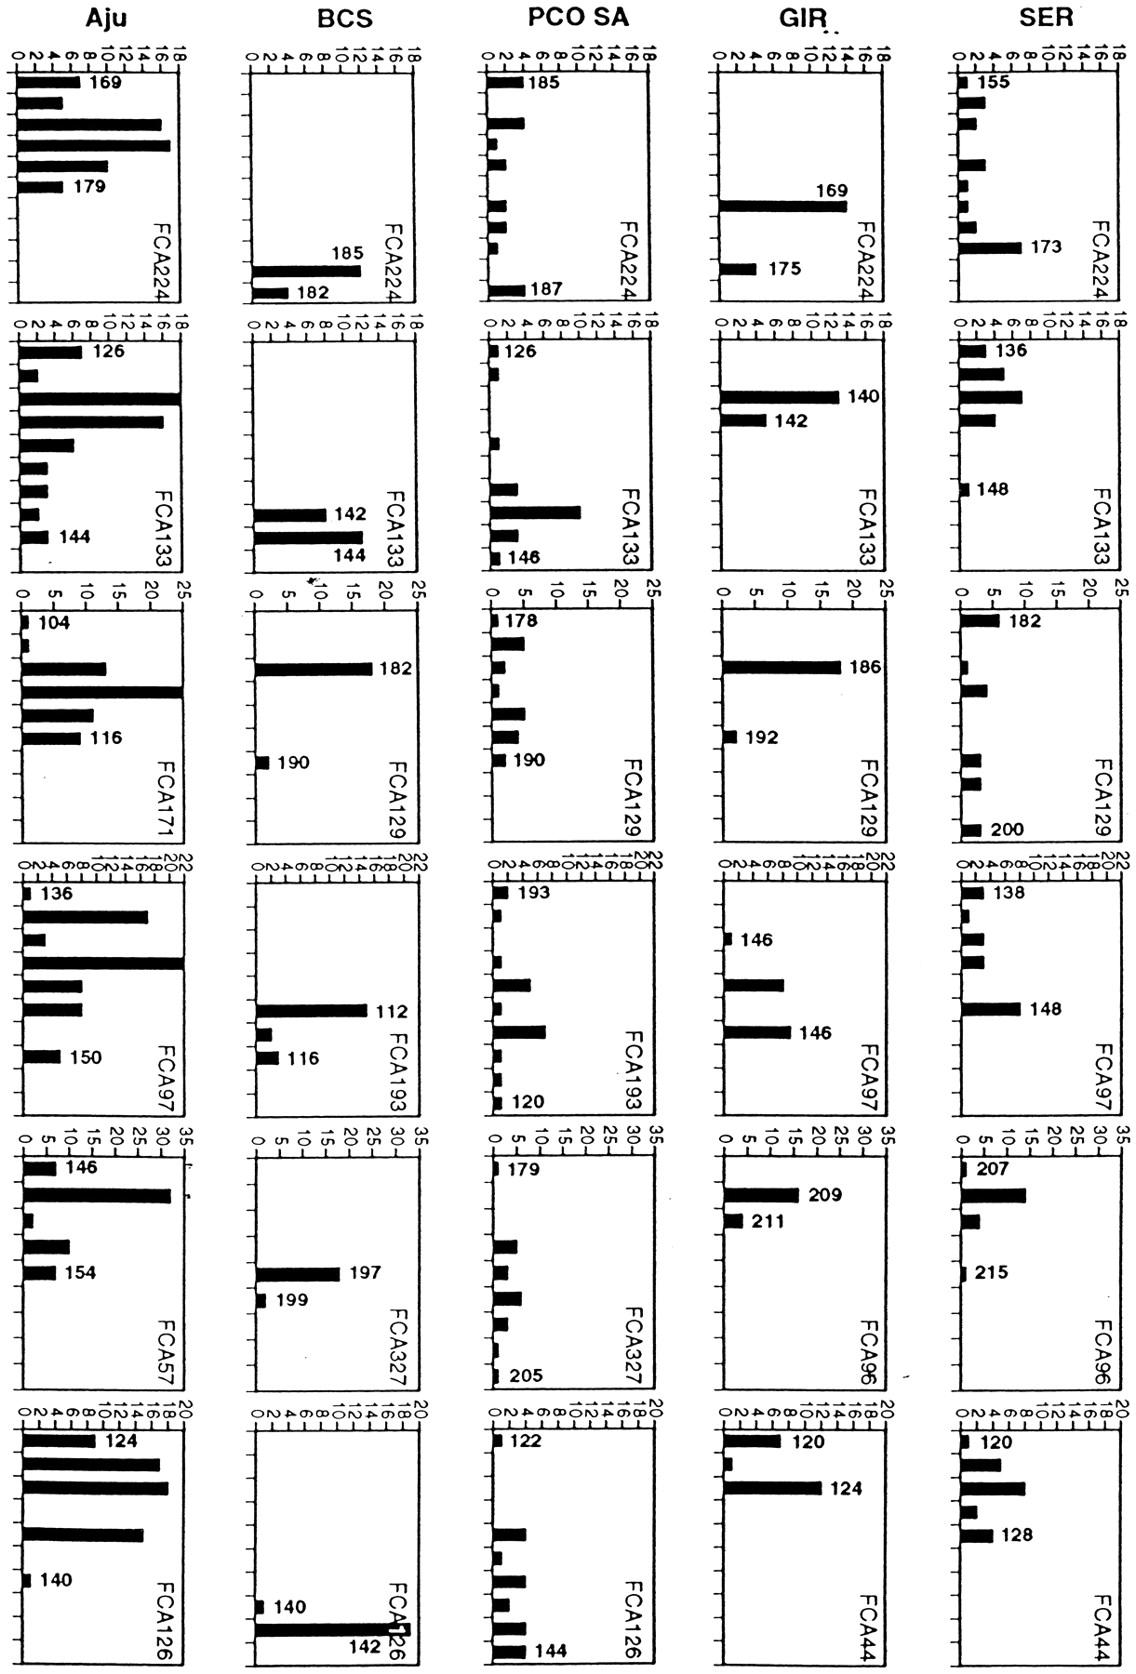
Figure 3.
Frequency distribution of alleles at homologous microsatellite loci among lions (SER and GIR), pumas (PCO-SA and BCS), and cheetahs (Aju). Each graph shows 2-bp (CA repeat) increments on either side of the most common allele in the outbred population plotted (horizontal axis) against number of alleles (vertical axis). For homologous loci, allele sizes are comparable within species, but not between species. Allele size of the largest and smallest alleles for each population are indicated by number above bar. FCA### is the name of the actual microsatellite locus (Menotti-Raymond et al. 1999).


