
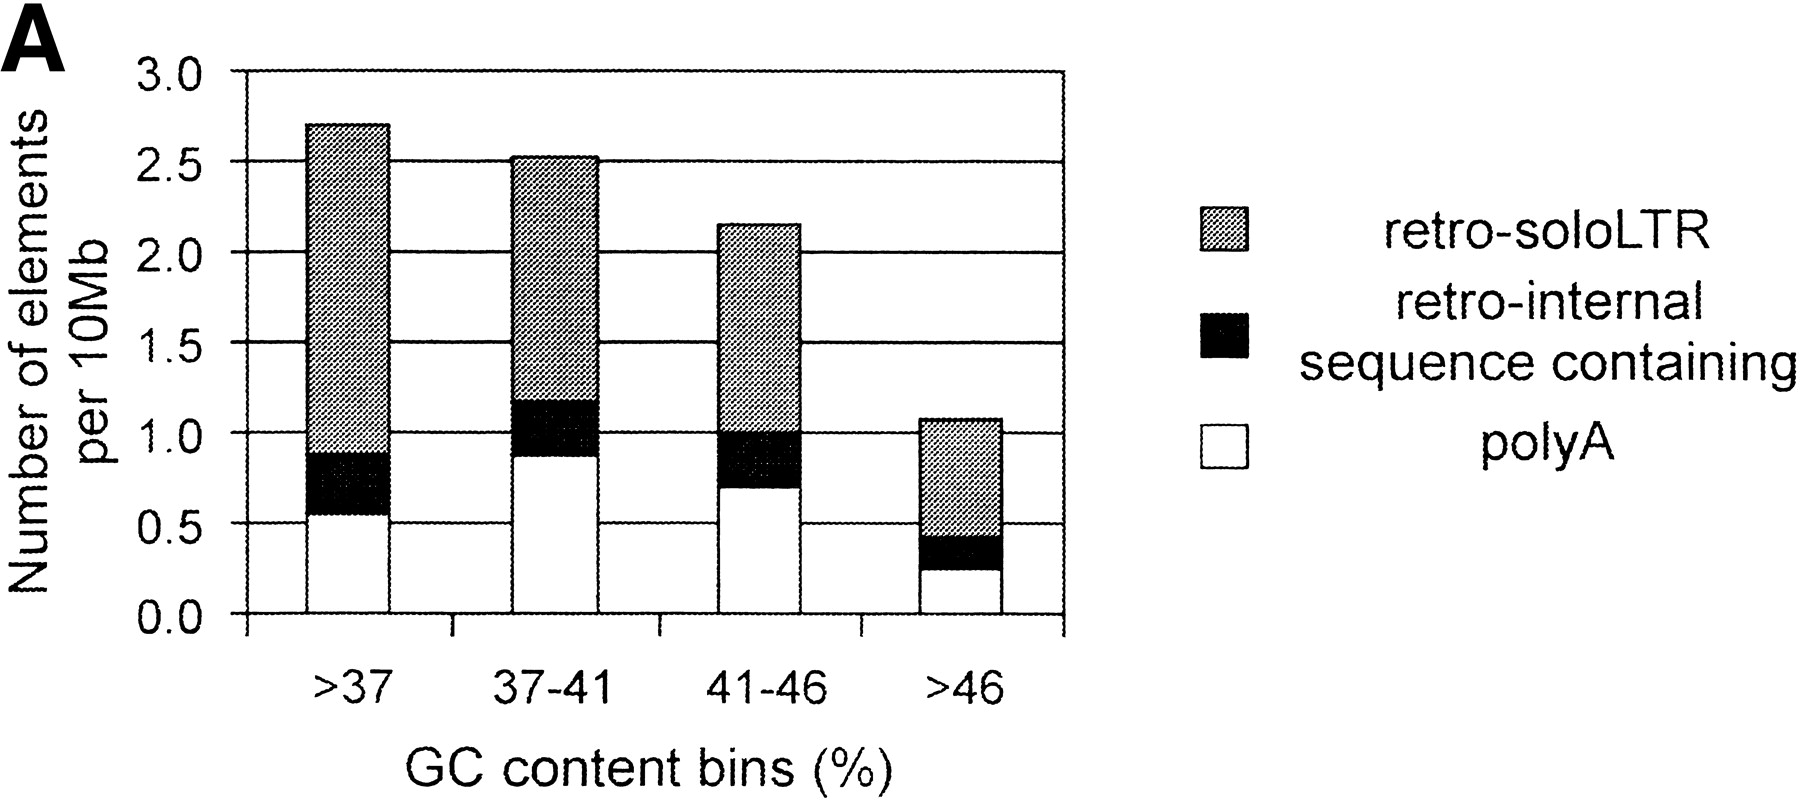
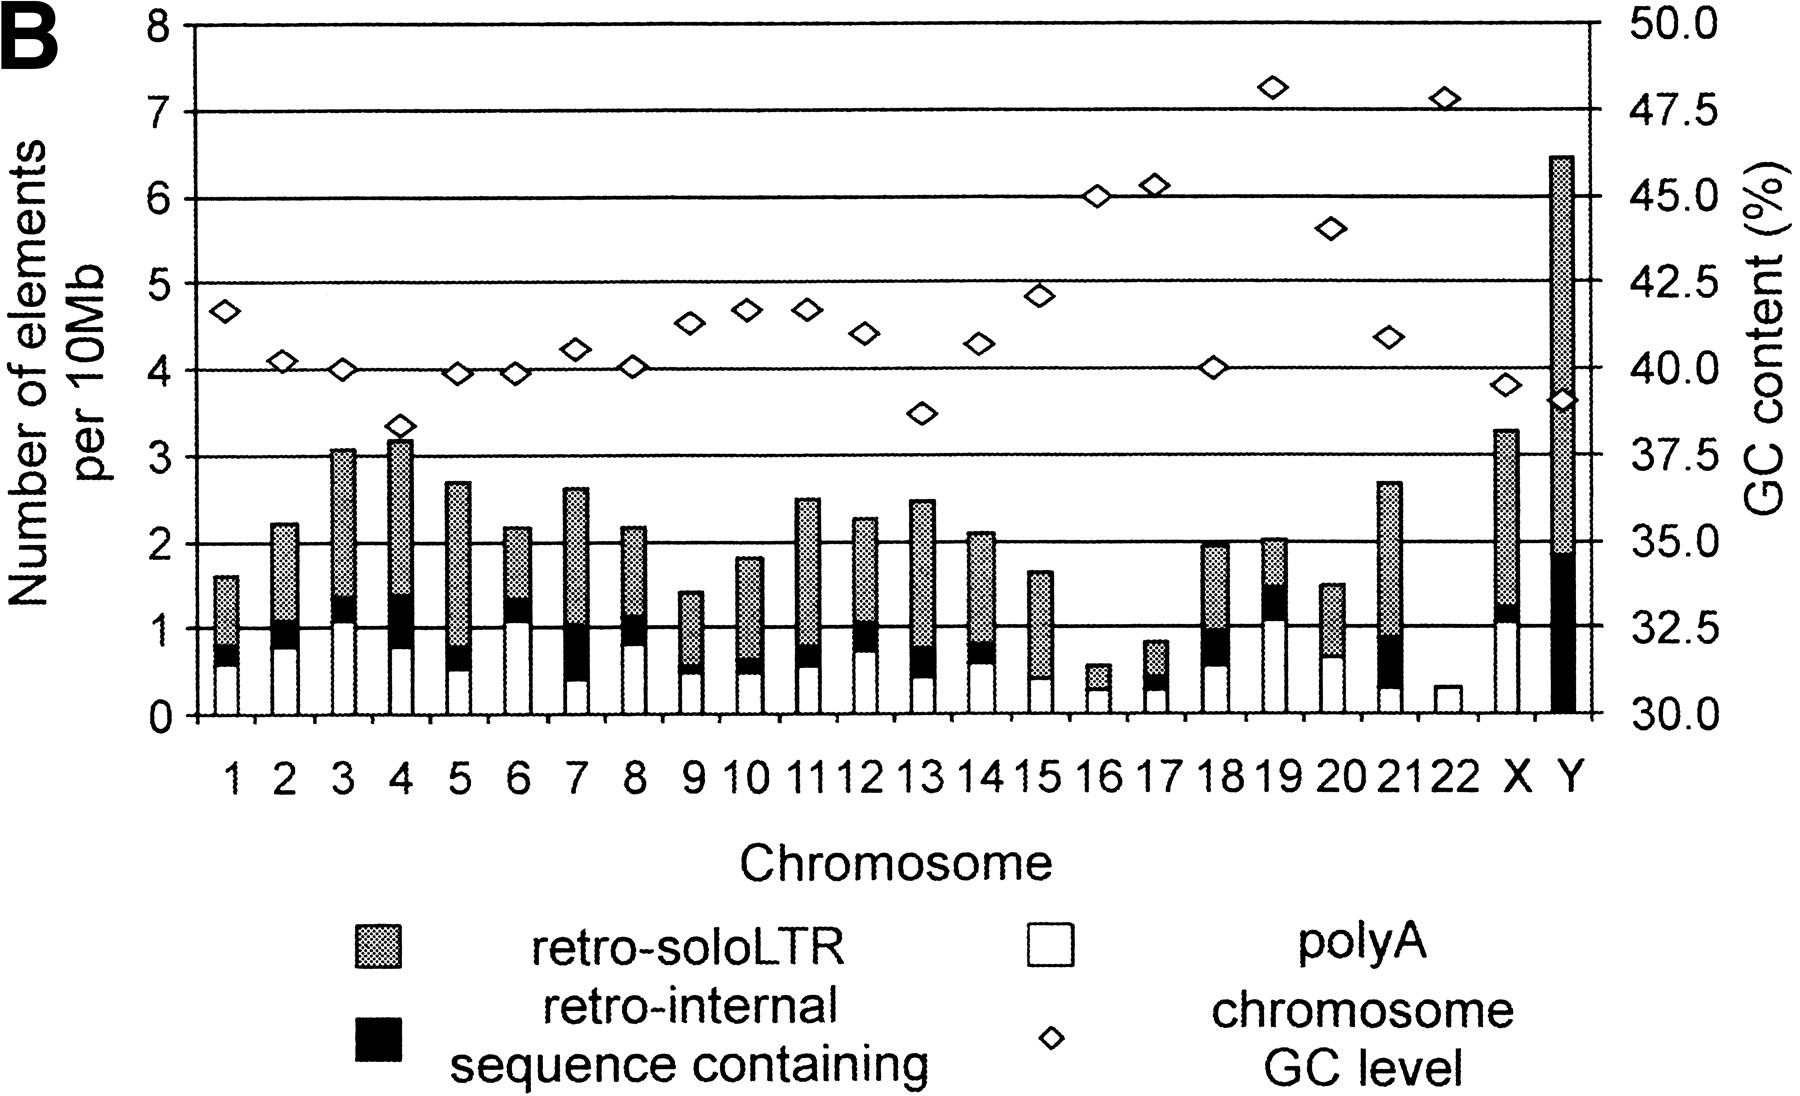
Figure 4.
Genomic distribution of HERV-W elements. (A) Isochore distribution of poly(A), soloLTR, and other retroviral (internal sequence-containing) copies was calculated in 100-kb long, nonoverlapping segments. The distribution is shown in the number of independent elements per 10 Mb. Four categories of GC levels corresponding to four isochore families were used (see Methods). (B) The chromosome distribution is shown as a number of independent elements per 10 Mb (left y axis). The bars represent chromosomal densities of poly(A), soloLTR, as well as internal sequence-containing retro copies. The GC levels of chromosomes are shown as diamonds (right y axis).


