
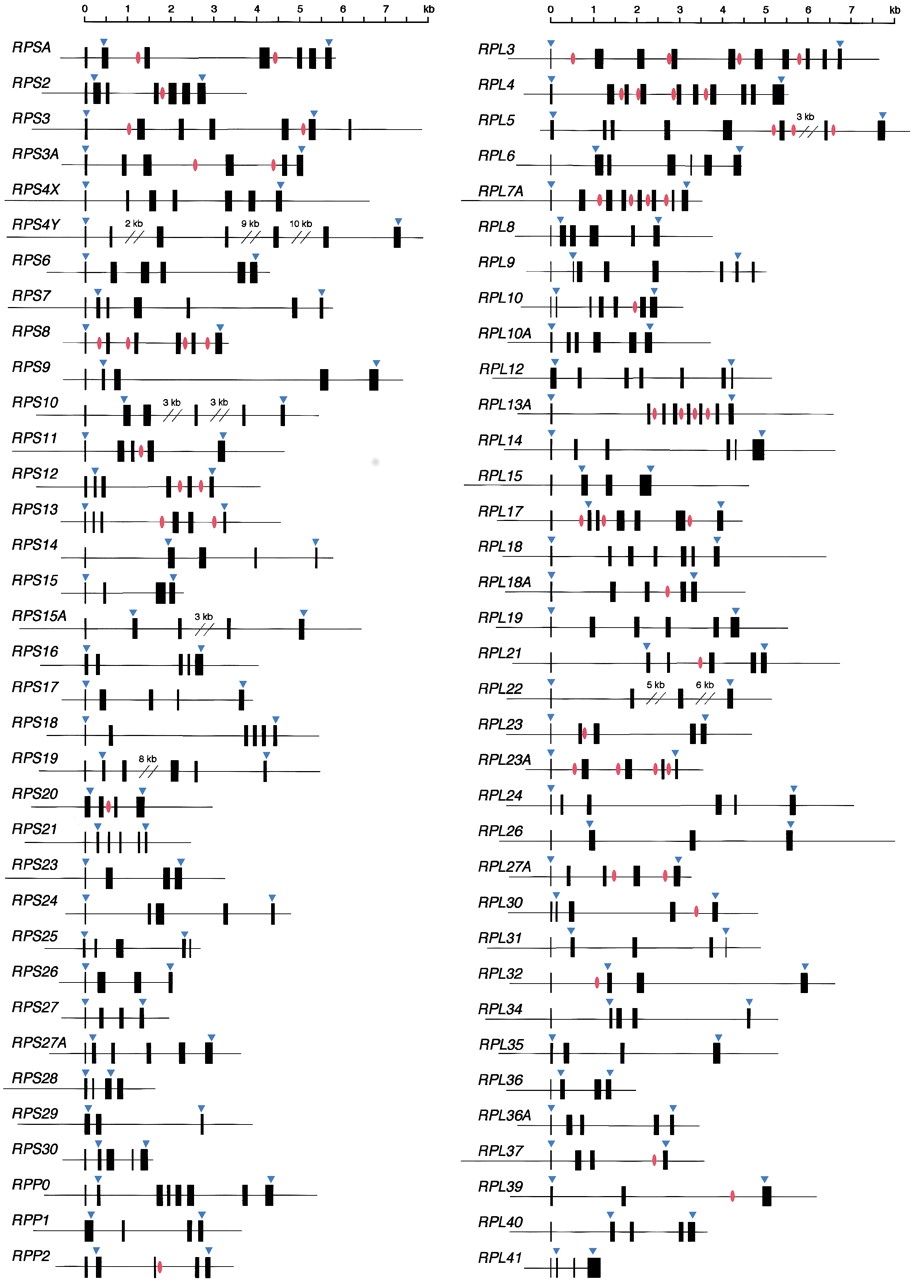
Figure 1.
Schematic representation of RP gene organization. Solid boxes indicate exons. Arrowheads show the position corresponding to the translation start and stop sites. Red circles represent the position of the snoRNA genes.


