
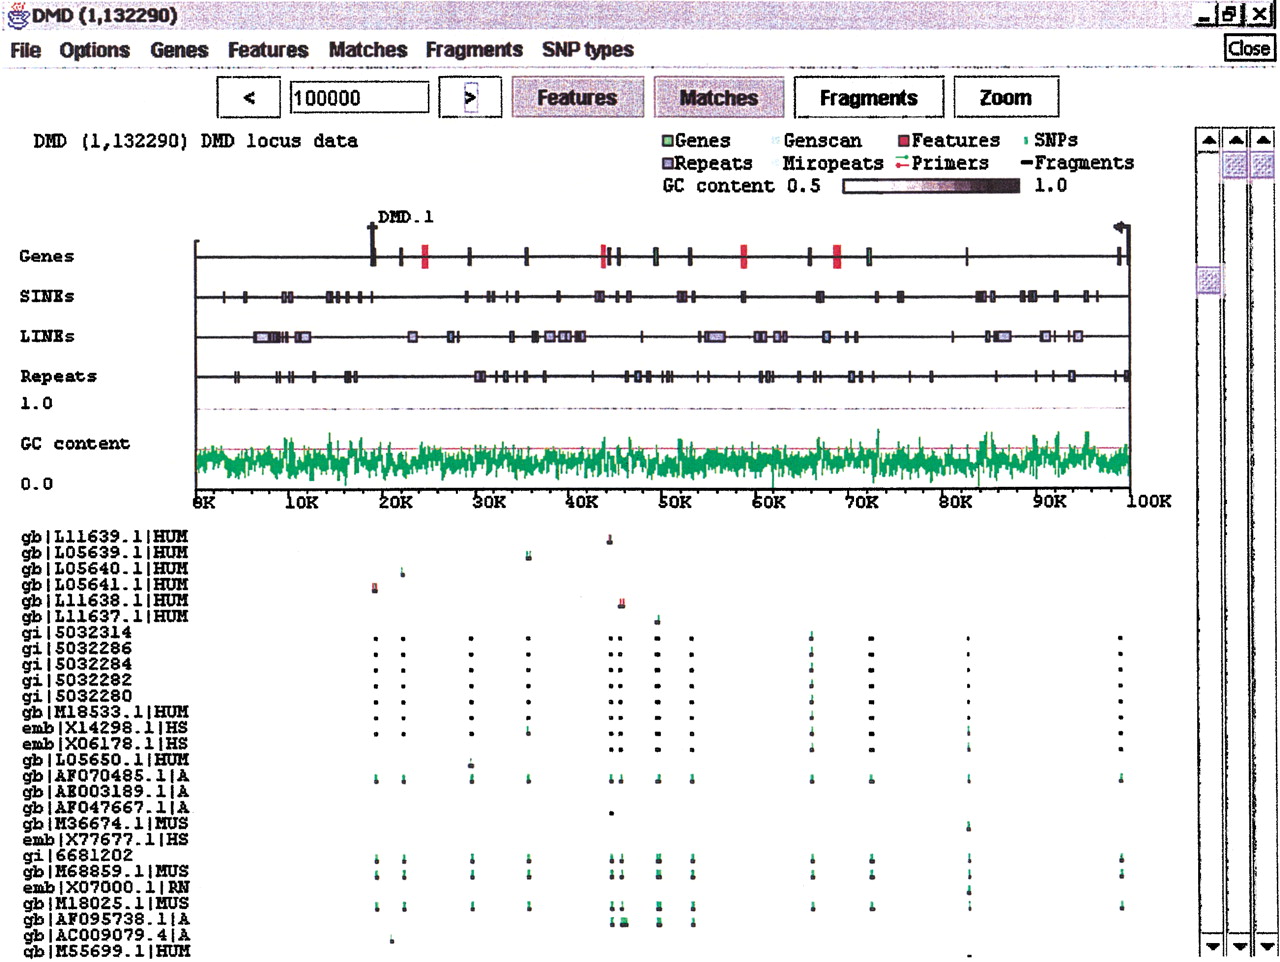
Expanded Features subwindow. The dystrophin region from Fig. 2 with several additions. The Features subwindow has been expanded to separate classes of features, and to present GC content as a line graph. Sequence and exon data are still derived from the GenBank record, but the repeat information (blue boxes) has been replaced by output fromRepeatMasker. Clicking on a particular repeat will bring up the corresponding data from the RepeatMasker output. Light blue areas on the Genes line denote internally repeated regions derived from Miropeats. Clicking on one of these areas will bring up the Miropeats output file and, in addition, will highlight the matching area elsewhere on the sequence. ABLAST search of the dystrophin region against the nr database has been loaded into the Matches subwindow. Dark bars denote the matching areas, and green and red tick marks identify base differences between the matched sequence and dystrophin (green for substitutions, red for indels).


