
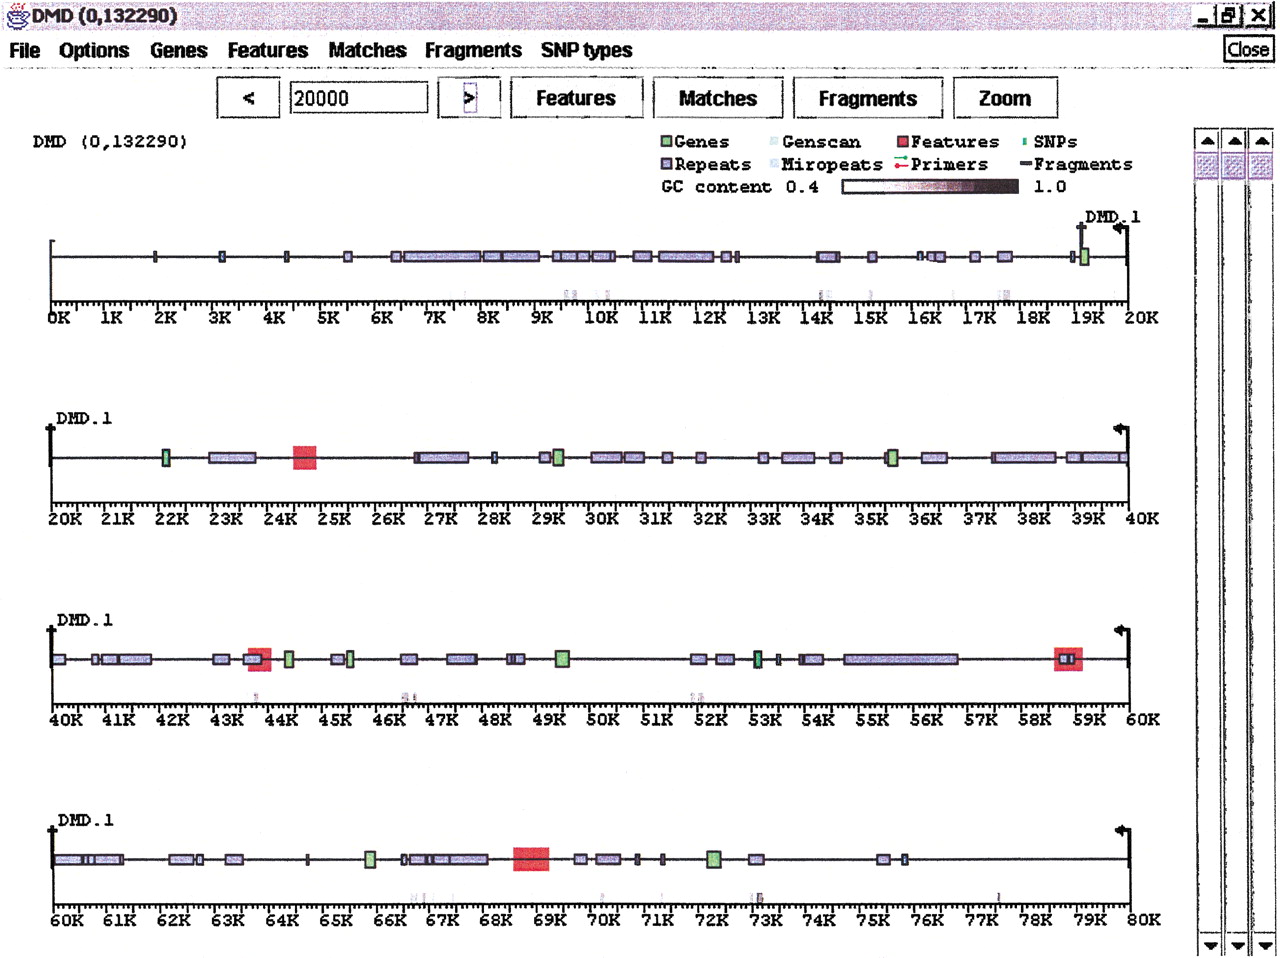
Figure 2.
The Features subwindow: Data from GenBank record AL031542, containing 13 exons of the human dystrophin gene, is shown with green boxes representing the exons of “CDS” tags, blue boxes representing “repeat region” tags, and red areas defining “misc feature” tags. The user can click on any box and obtain details about the feature, control which types and classes of features are displayed, and label features. Grey bars above the scale denote areas where sequence GC content is above a threshold value (in this case,40%).


