
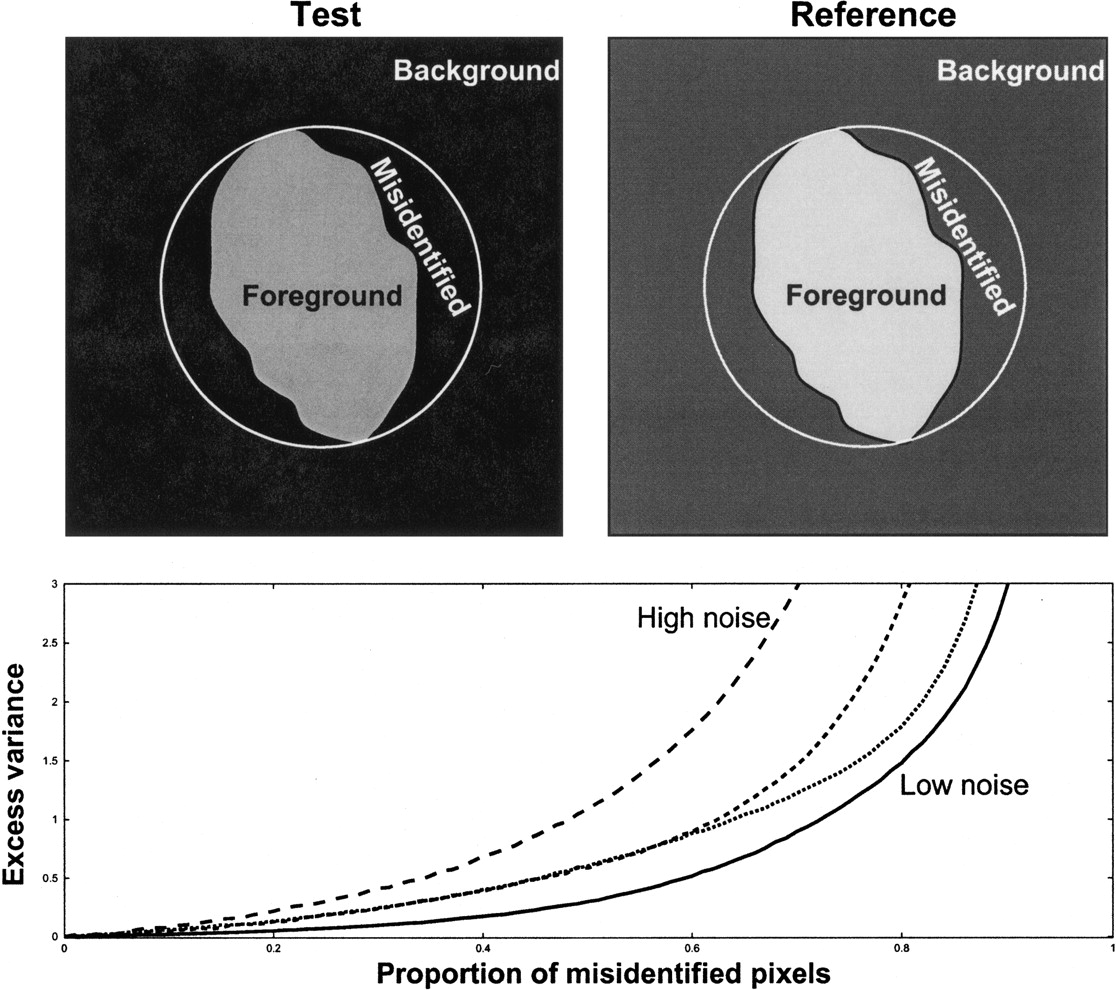
Figure 2.
Depiction of a noncircular spot, in which a circular spot assumption leads to signal dilution. Top: idealized test and reference images, with foreground and background identified. Bottom: plot of the relationship between variance of log(T/R) vs. proportion of misidentified target pixels, assuming various levels of absolute signal intensity and noise in the estimates of foreground and background.


