
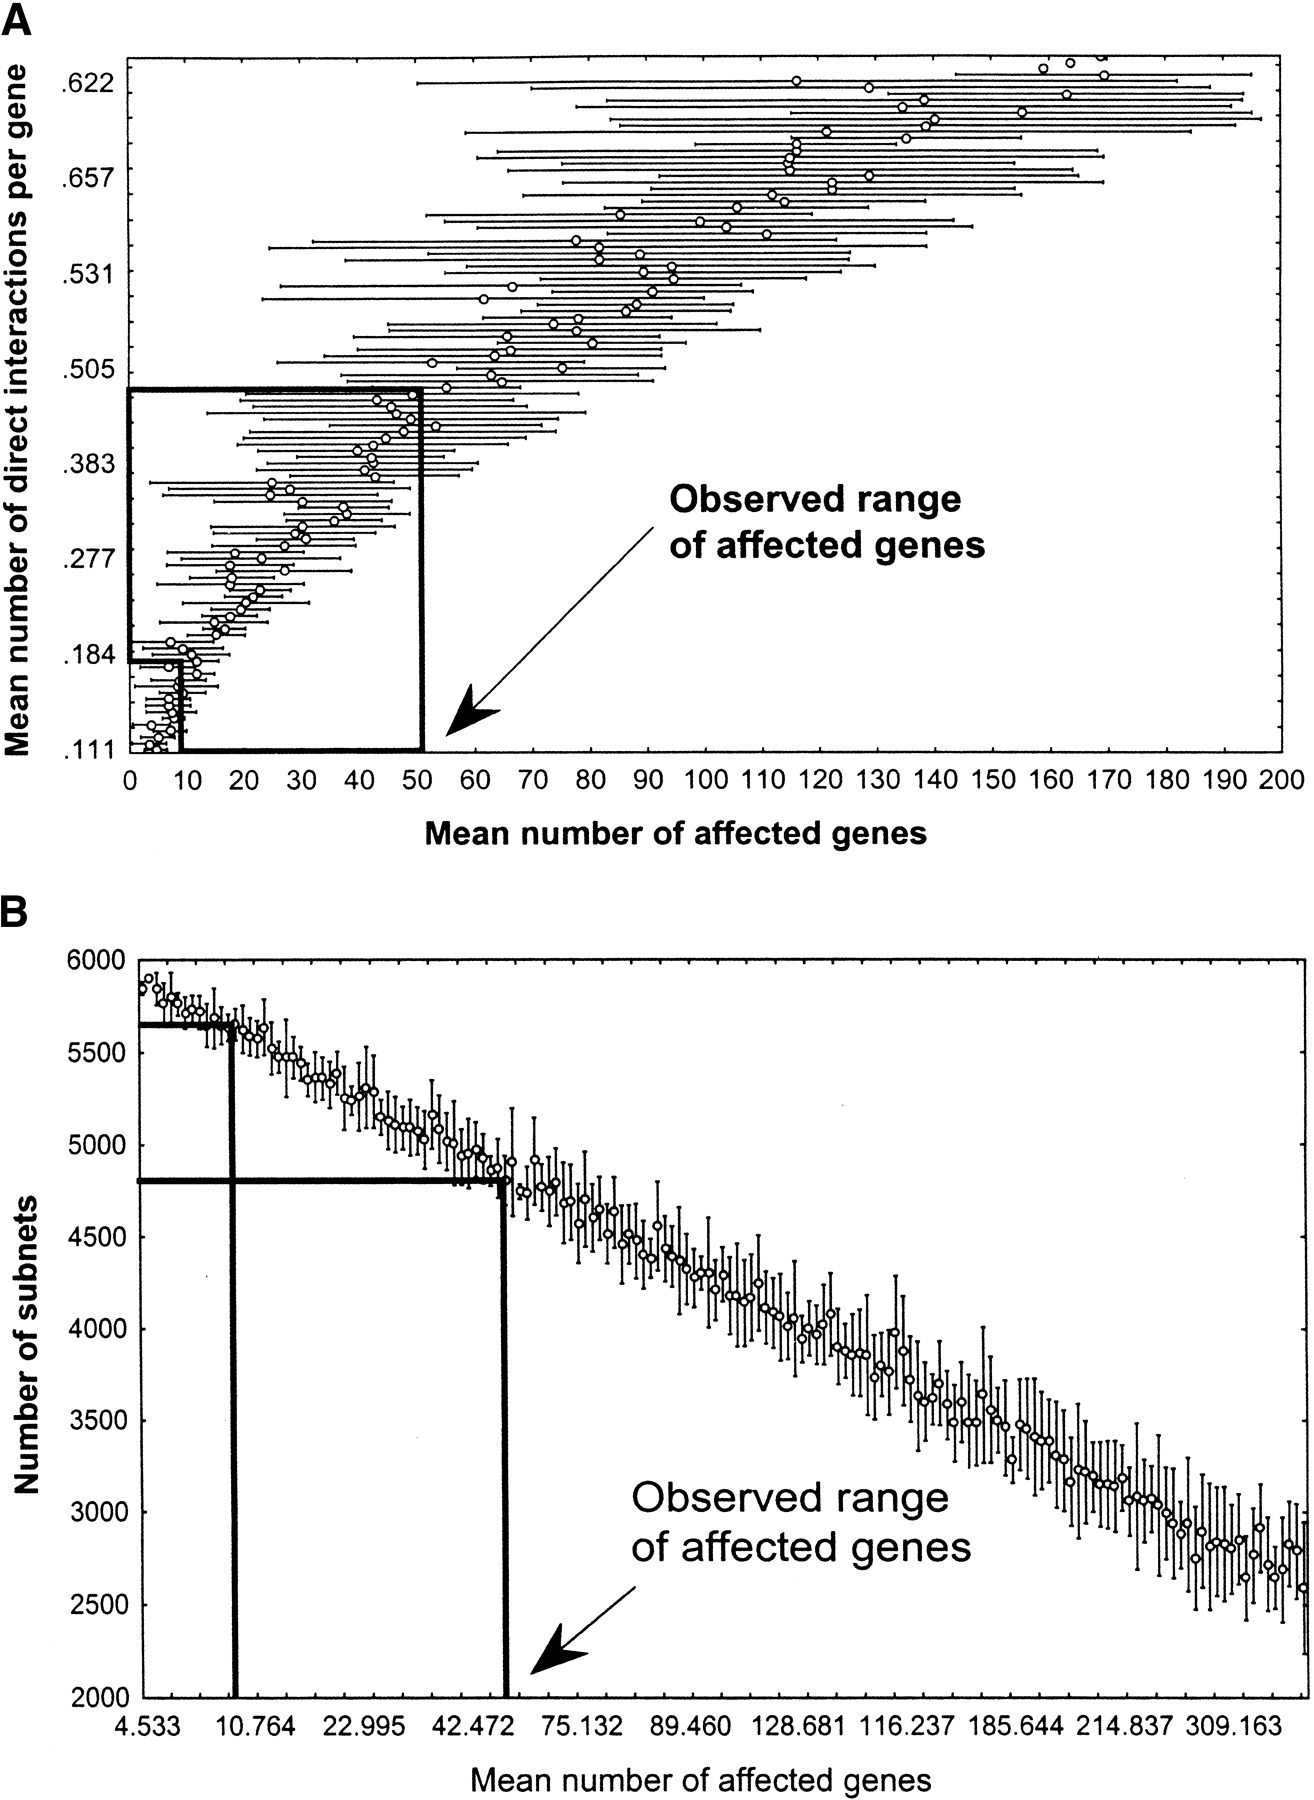
Connectivity and subnet number in networks with power law degree distribution. (A) Mean number of direct interactions per gene (y-axis, the connectivity of the network) as a function of the mean number of genes affected by a genetic perturbation (x-axis). (B) Number of subnets in a random network as a function of the number of genes affected by a genetic perturbation. (Boxed regions) Upper and lower boundaries of the mean number of genes affected by a perturbation, according to experimental data (Hughes et al. 2000, Fig. 2B). The corresponding range of subnets is 4584–5638 (ς = 153 and ς = 92, respectively), most of which are isolated genes. Notice that the scale of both x-axes corresponds approximately to that of the insets in Fig. 3.


