
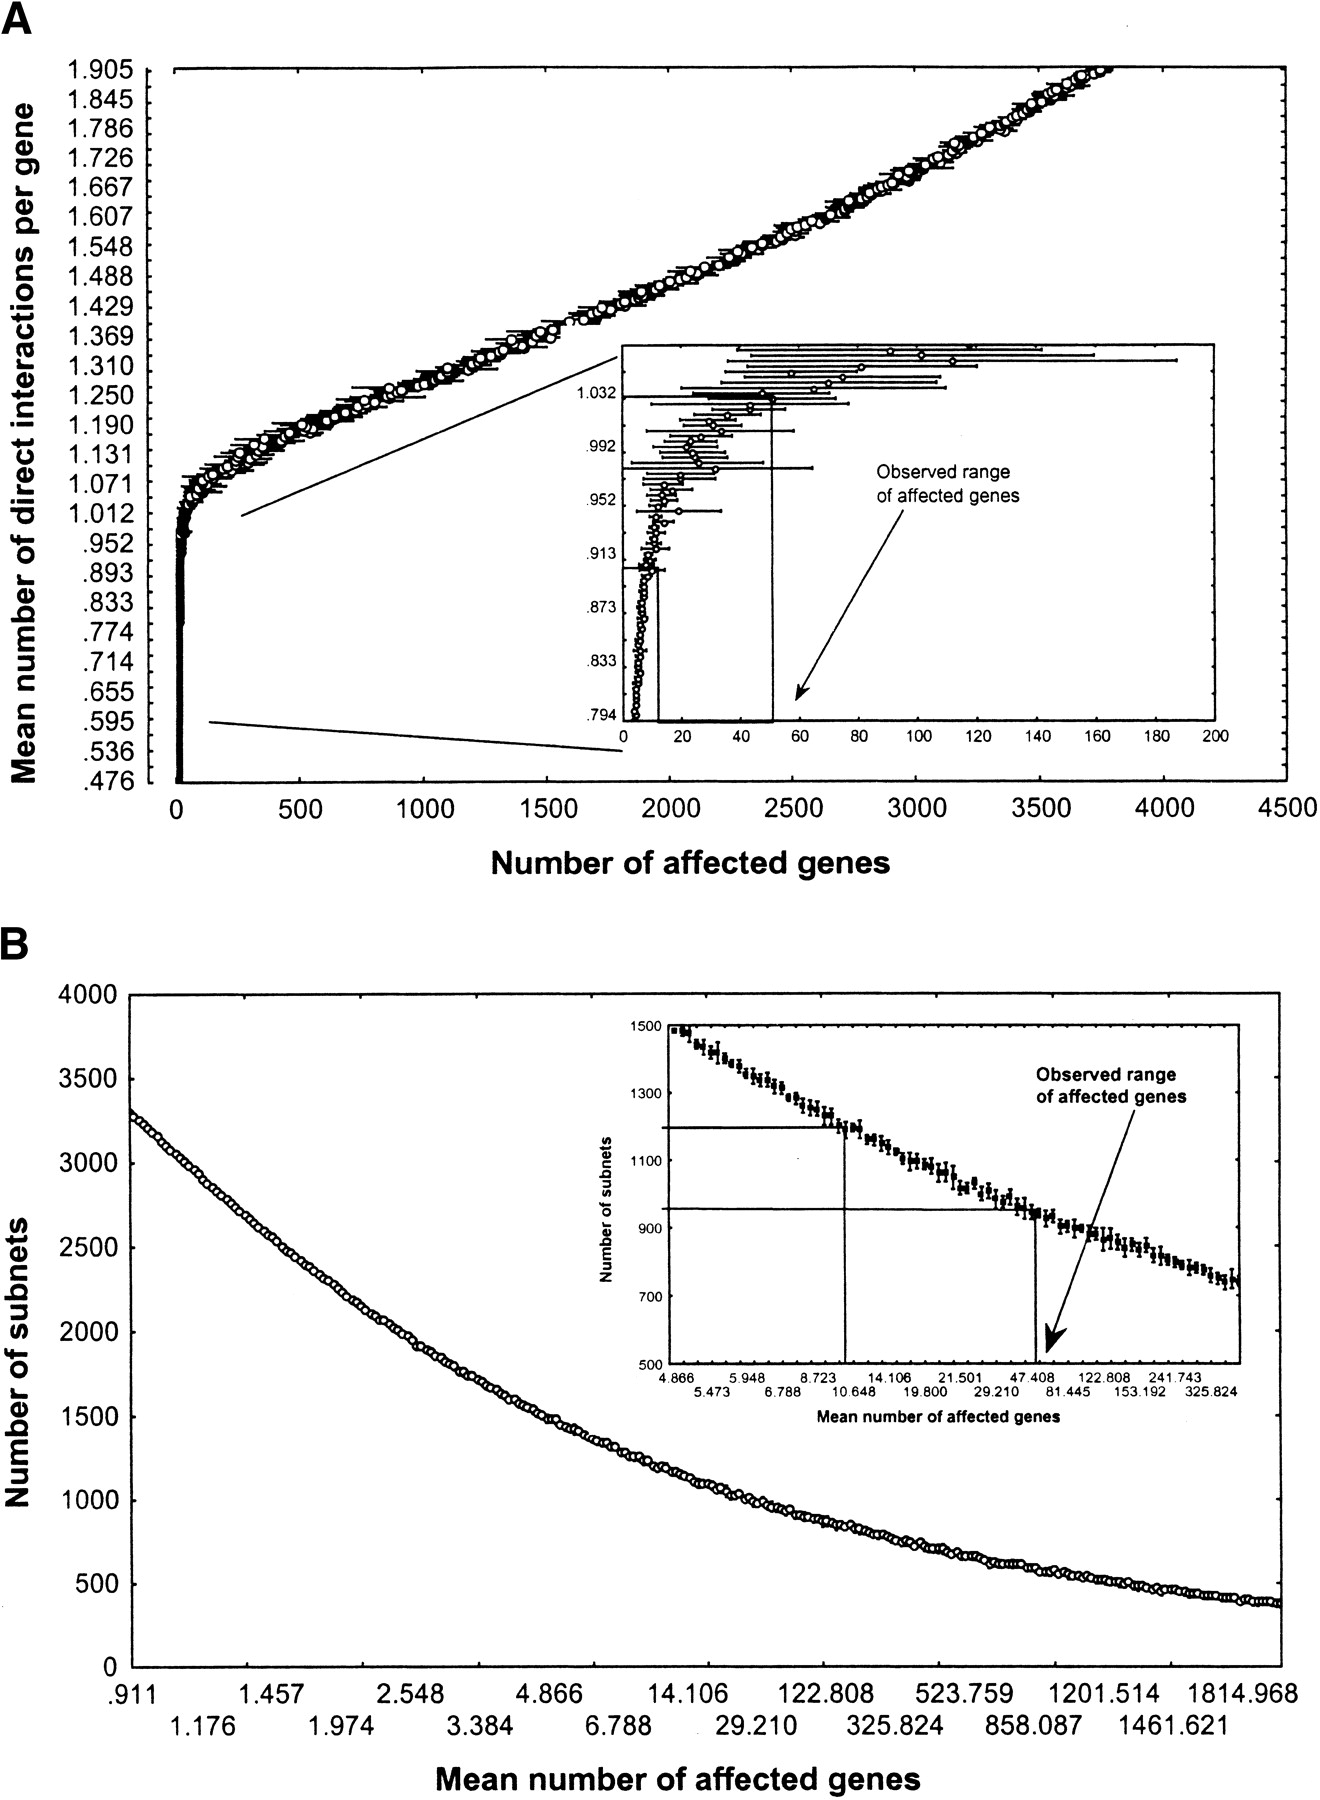
Connectivity and module number in ER networks. (A) Mean number of direct interactions per gene (y-axis, the connectivity of the network) as a function of the mean number of genes affected by a genetic perturbation (x-axis). (Inset) Same relation for a part of the connectivity range, together with the experimentally observed range of the mean number of genes whose expression is affected by a gene deletion (Fig. 2B). This range maps onto a narrow interval of direct regulatory interactions, d, per gene (0.9<d<1.05, approximately). (B) Number of subnets in a random network as a function of the number of genes affected by a genetic perturbation. (Inset) Same relation for a part of the range, together with the experimentally observed range of genes affected by a perturbation.


