
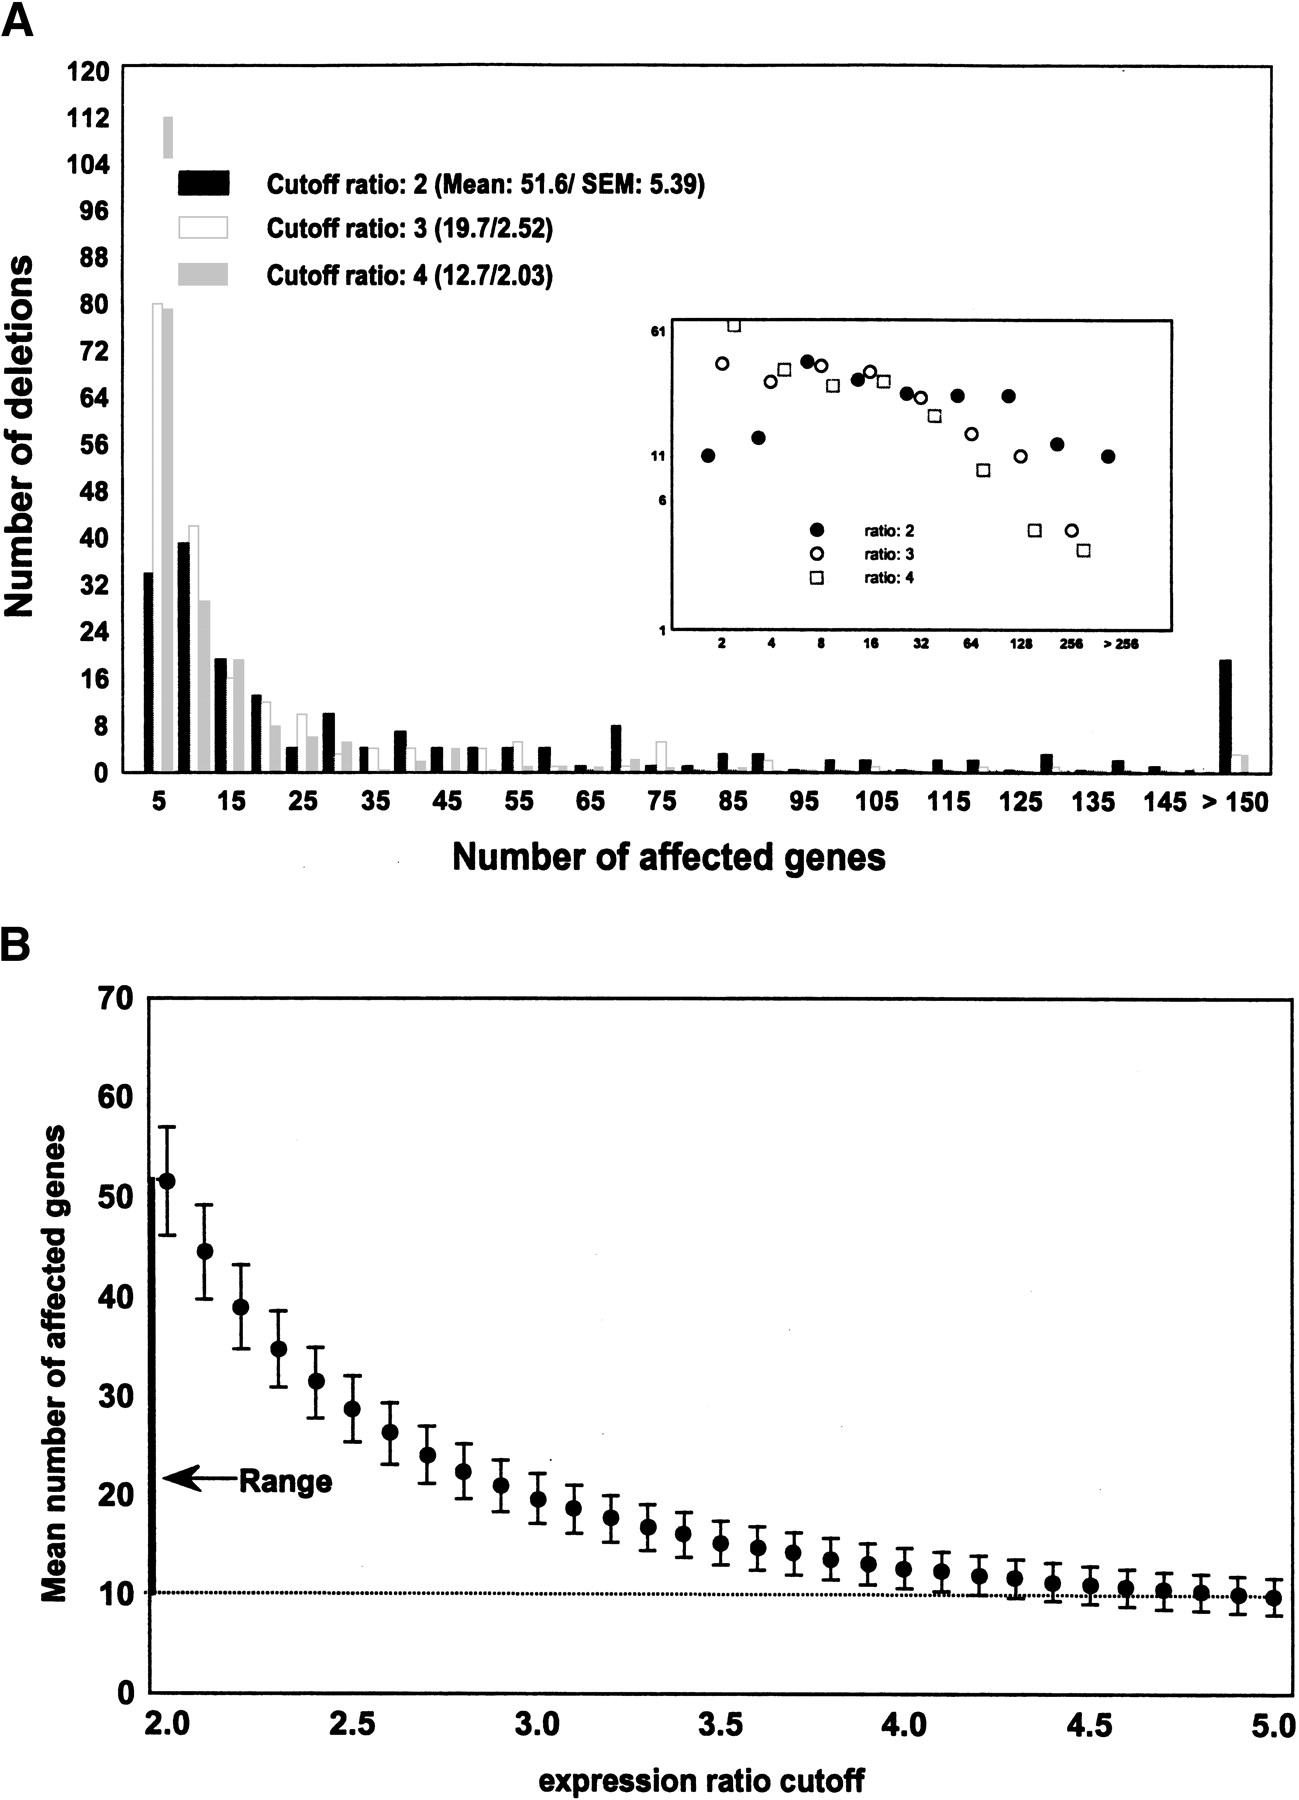
Figure 2.
Number of genes affected by a genetic perturbation. (A) Distribution of the number of genes whose mRNA expression levels changes as a result of a gene deletion for three different significance thresholds R of expression ratios. (Inset) Same distribution on a log–log scale. (B) Mean and standard error of the mean (S.E.M.) of the number of genes whose expression ratio is affected by a genetic perturbation as a function of the significance threshold R. Averages are taken over the 196 genetic perturbations reported in (Hughes et al. 2000). The mean number of affected genes varies between 9.9 (R = 5; S.E.M. = 1.84) and 51.6 (R = 2; S.E.M. = 1.89) genes.


