
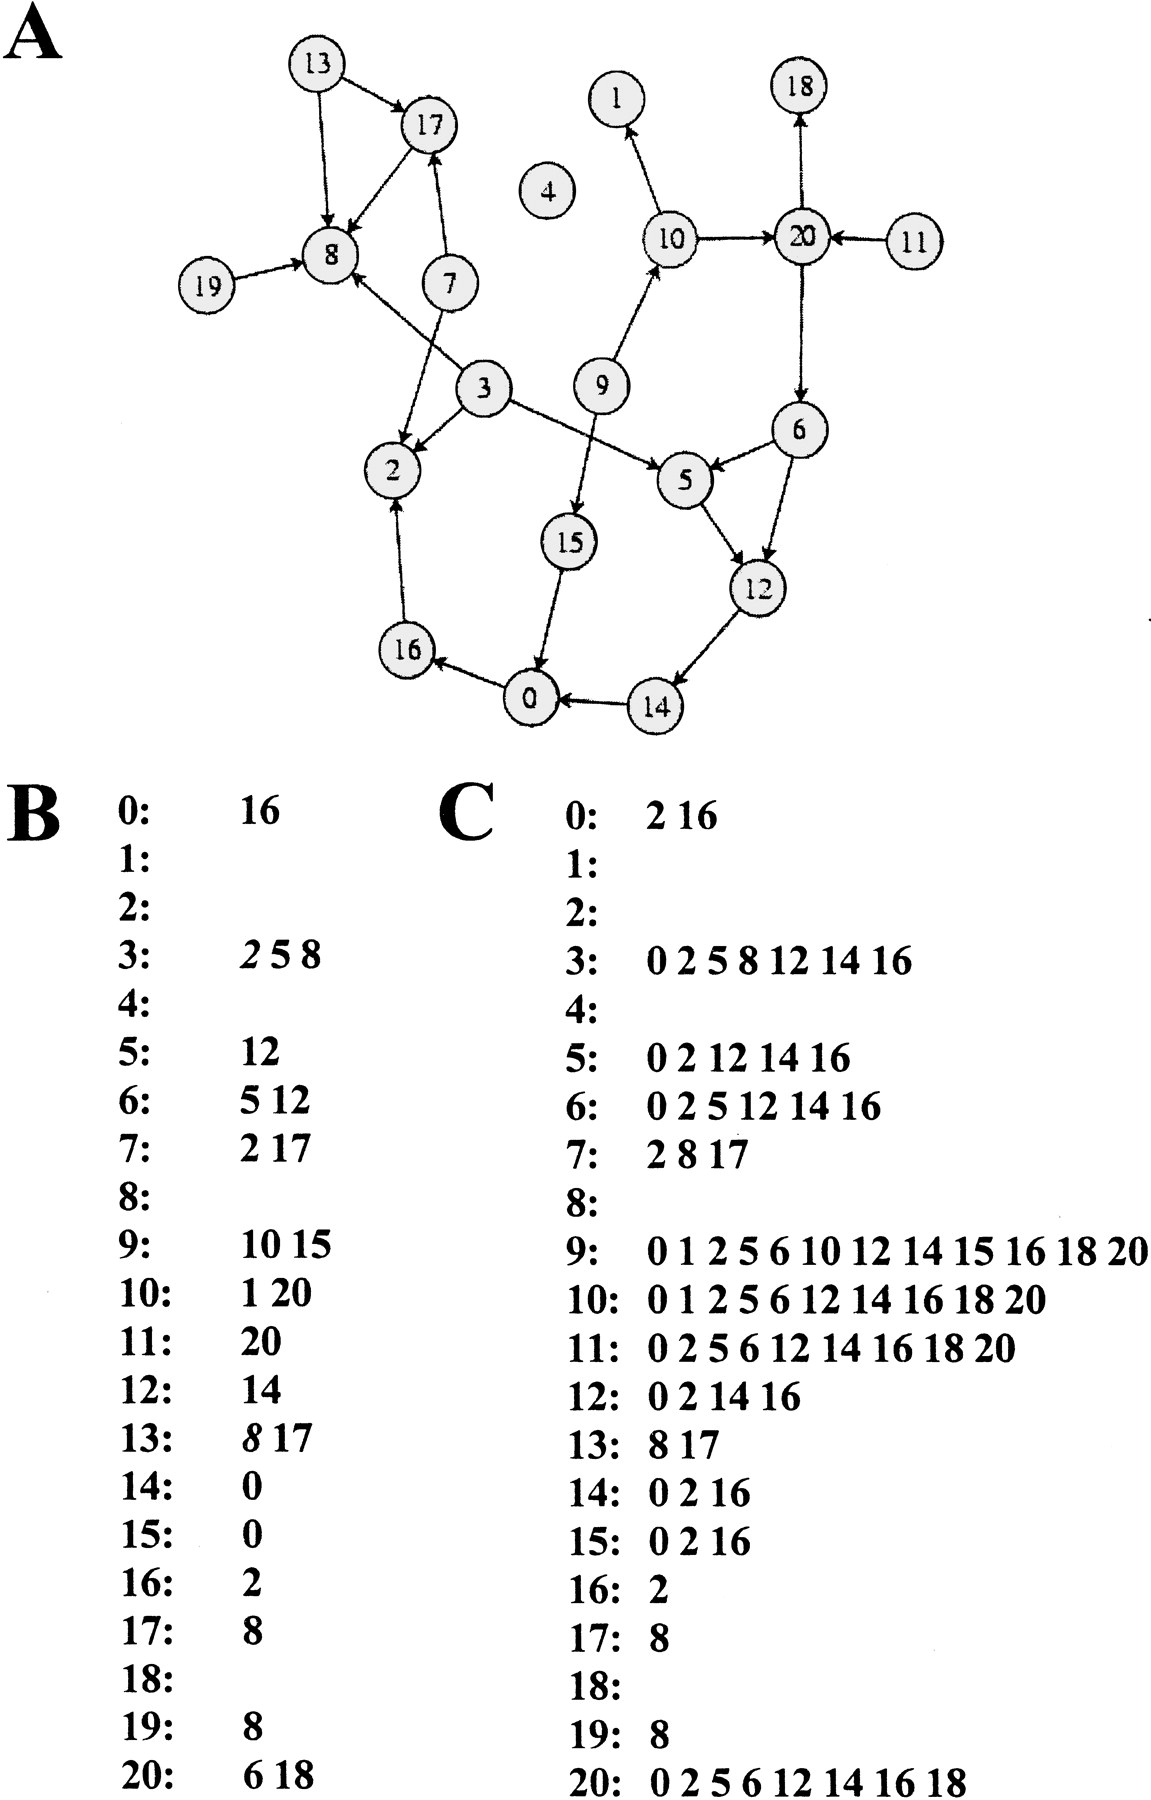
Direct and indirect perturbation effects in a genetic network. (A) Genetic network represented as a graph whose nodes correspond to genes numbered from 0 through 20. Two genes are connected by an arrow if they influence each other's activity directly. (B) List of direct regulatory interactions in the network. For each gene i (to the left of the colon), it is the list of all genes directly influenced by i. (C) List of direct and indirect perturbation effects for the network in A. When perturbing the activity of a gene i in the network, all genes whose activities are directly or indirectly influenced by this gene will change their activity. For each perturbed gene, one gets this list by following all paths leaving a gene along the arrows shown.


