
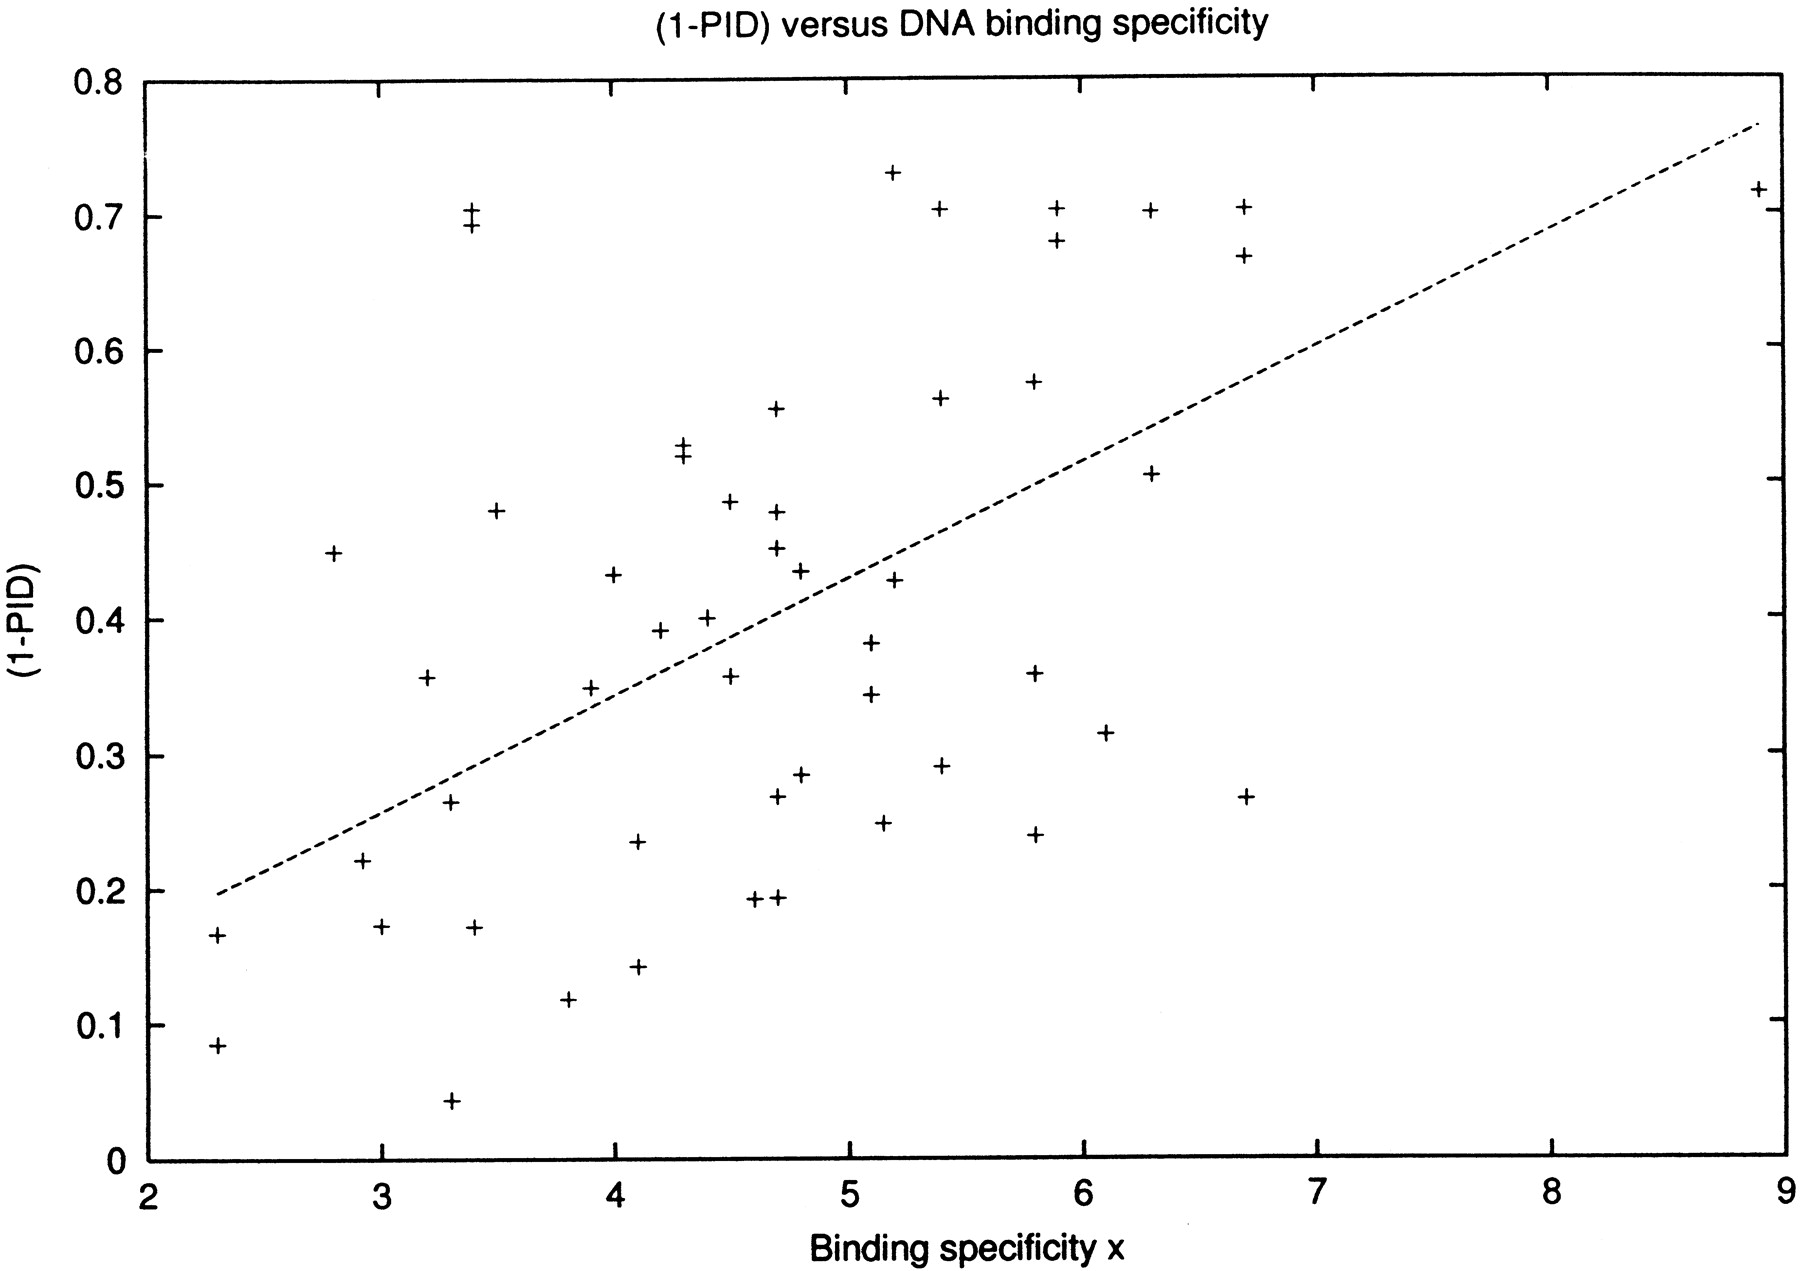
Figure 5.
Protein conservation and DNA binding specificity. The plot shows (1-PID) versus DNA binding specificity x Eq. (). Each data point corresponds to one of the 51 E. coli transcription factors which has an ortholog in Vibrio cholera. The straight line shown is a linear fit with slope 0.086 ± 0.005. Note that there is an upper cutoff of 0.7 in. (1-PID) since by definition, all orthologs have a PID of at least 0.3. The two obvious outliers atx = 3.4 and (1-PID) ∼ 0.7 are FarR and SoxS. Note that for some of the factors (e.g., FarR), only very few binding sites are known; that is, our estimate of the binding specificity has a large error.


