
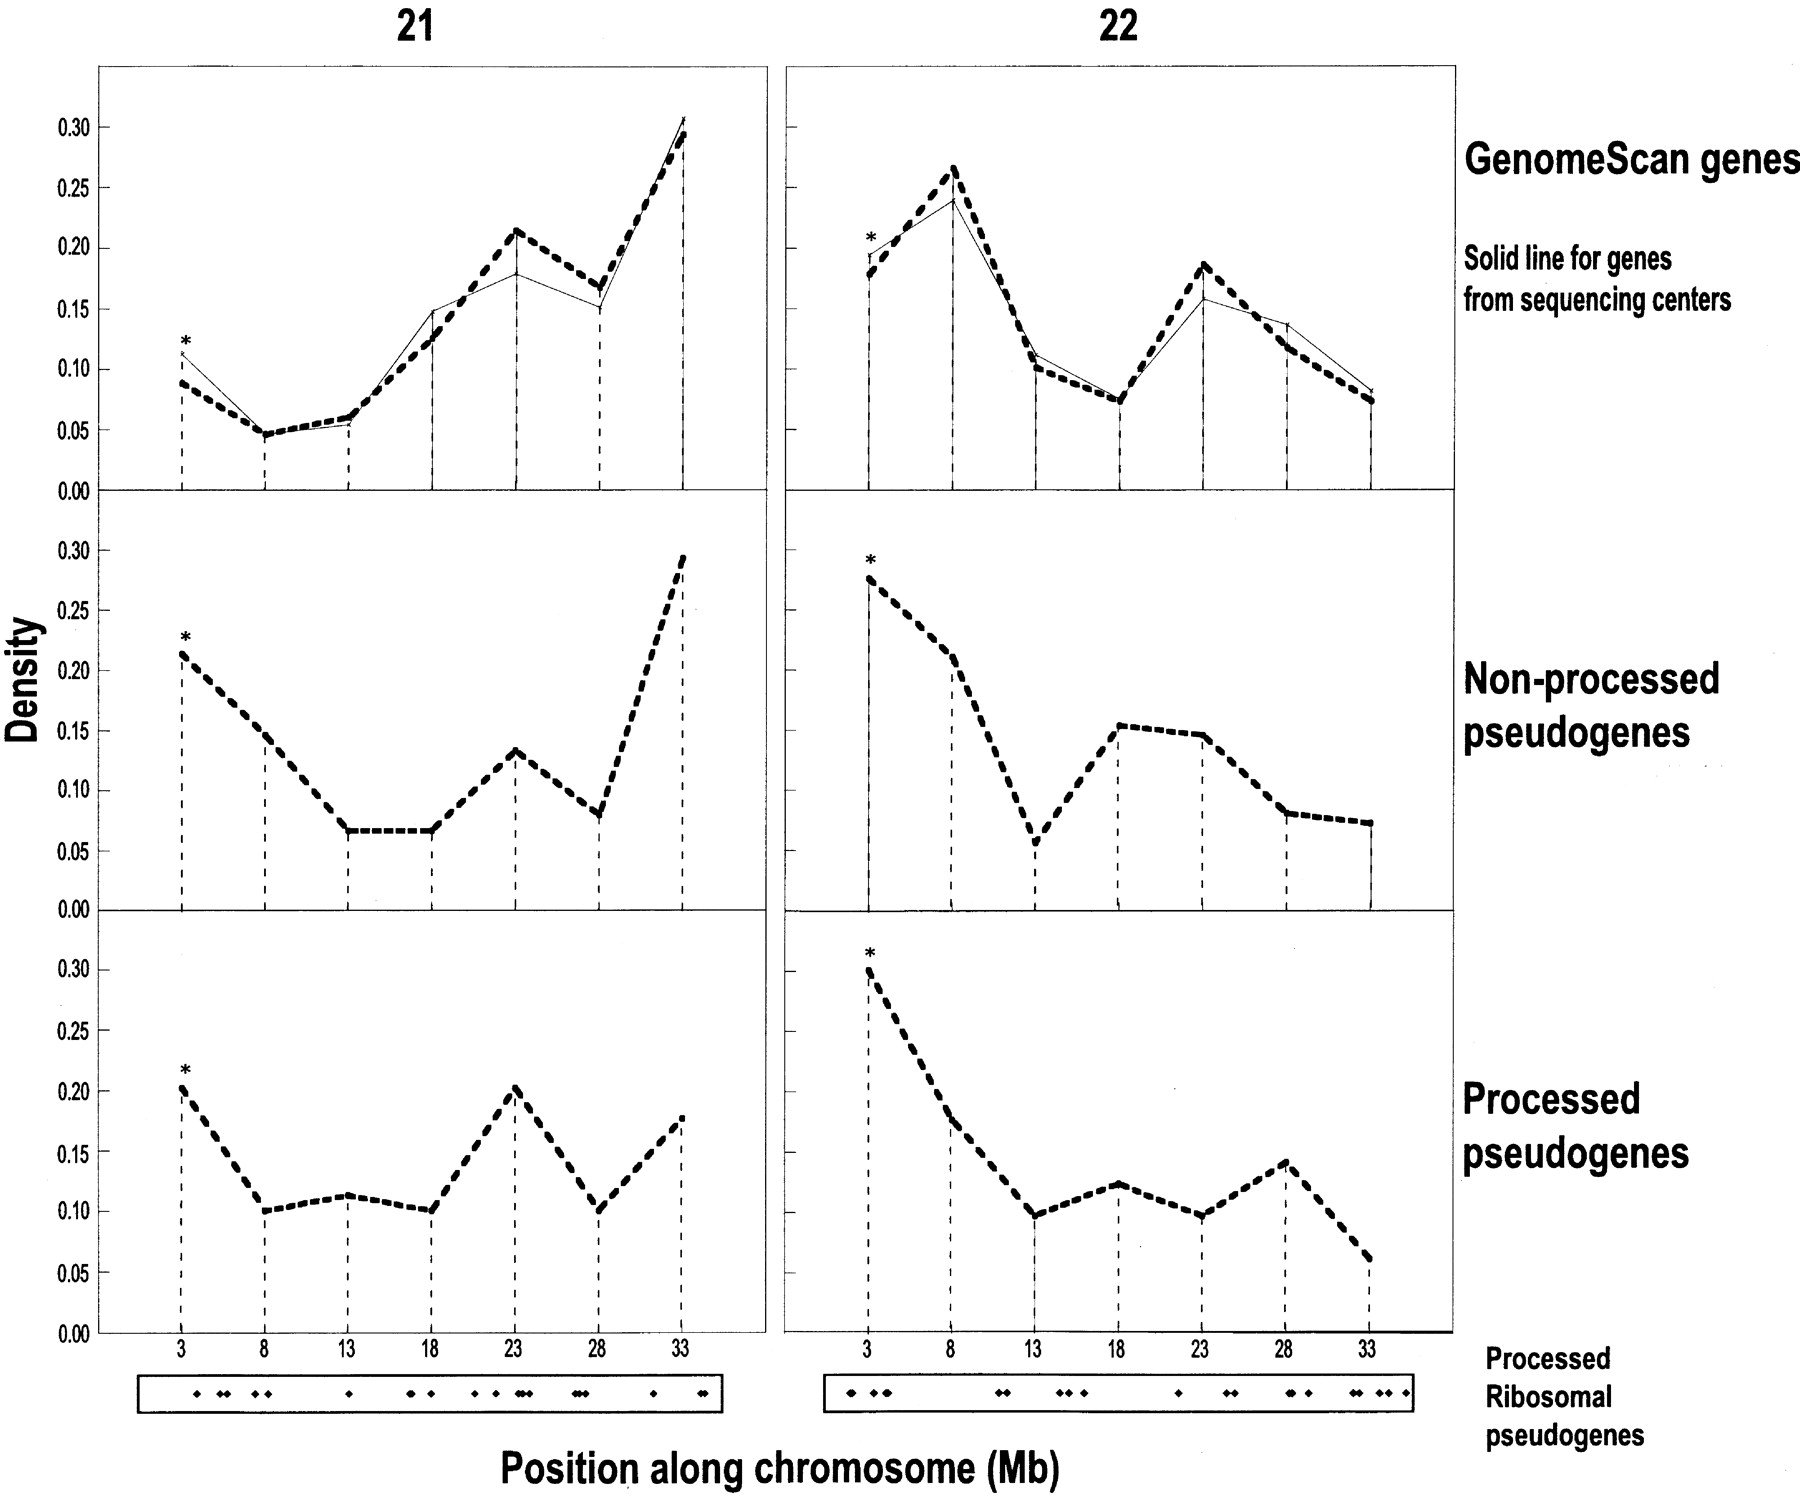
Distribution of pseudogene and gene densities for chromosomes 21 and 22. On the left are panels for chromosome 21, and on theright are panels for chromosome 22. For each chromosome, the panels are genes predicted by GenomeScan and the genome sequencing centers (Riken for chromosome 21 and Sanger for 22) (top), nonprocessed pseudogenes (middle), and processed pseudogenes (bottom). Each bin is named xfor the interval x to x + 5 Mb. The first bin contains ∼300,000 bases that are beyond the centromere (containing two genes and six pseudogenes). The final bin ends at the end of the telomere. The bins for the pseudogenic hot-spots referred to in the text are asterisked. For processed pseudogenes, we have added a representation of the distribution of ribosomal–protein processed pseudogenes along the chromosomes at the bottom of the panels, with a dot for each ribosomal–protein pseudogene at its approximate position along the chromosome.


