
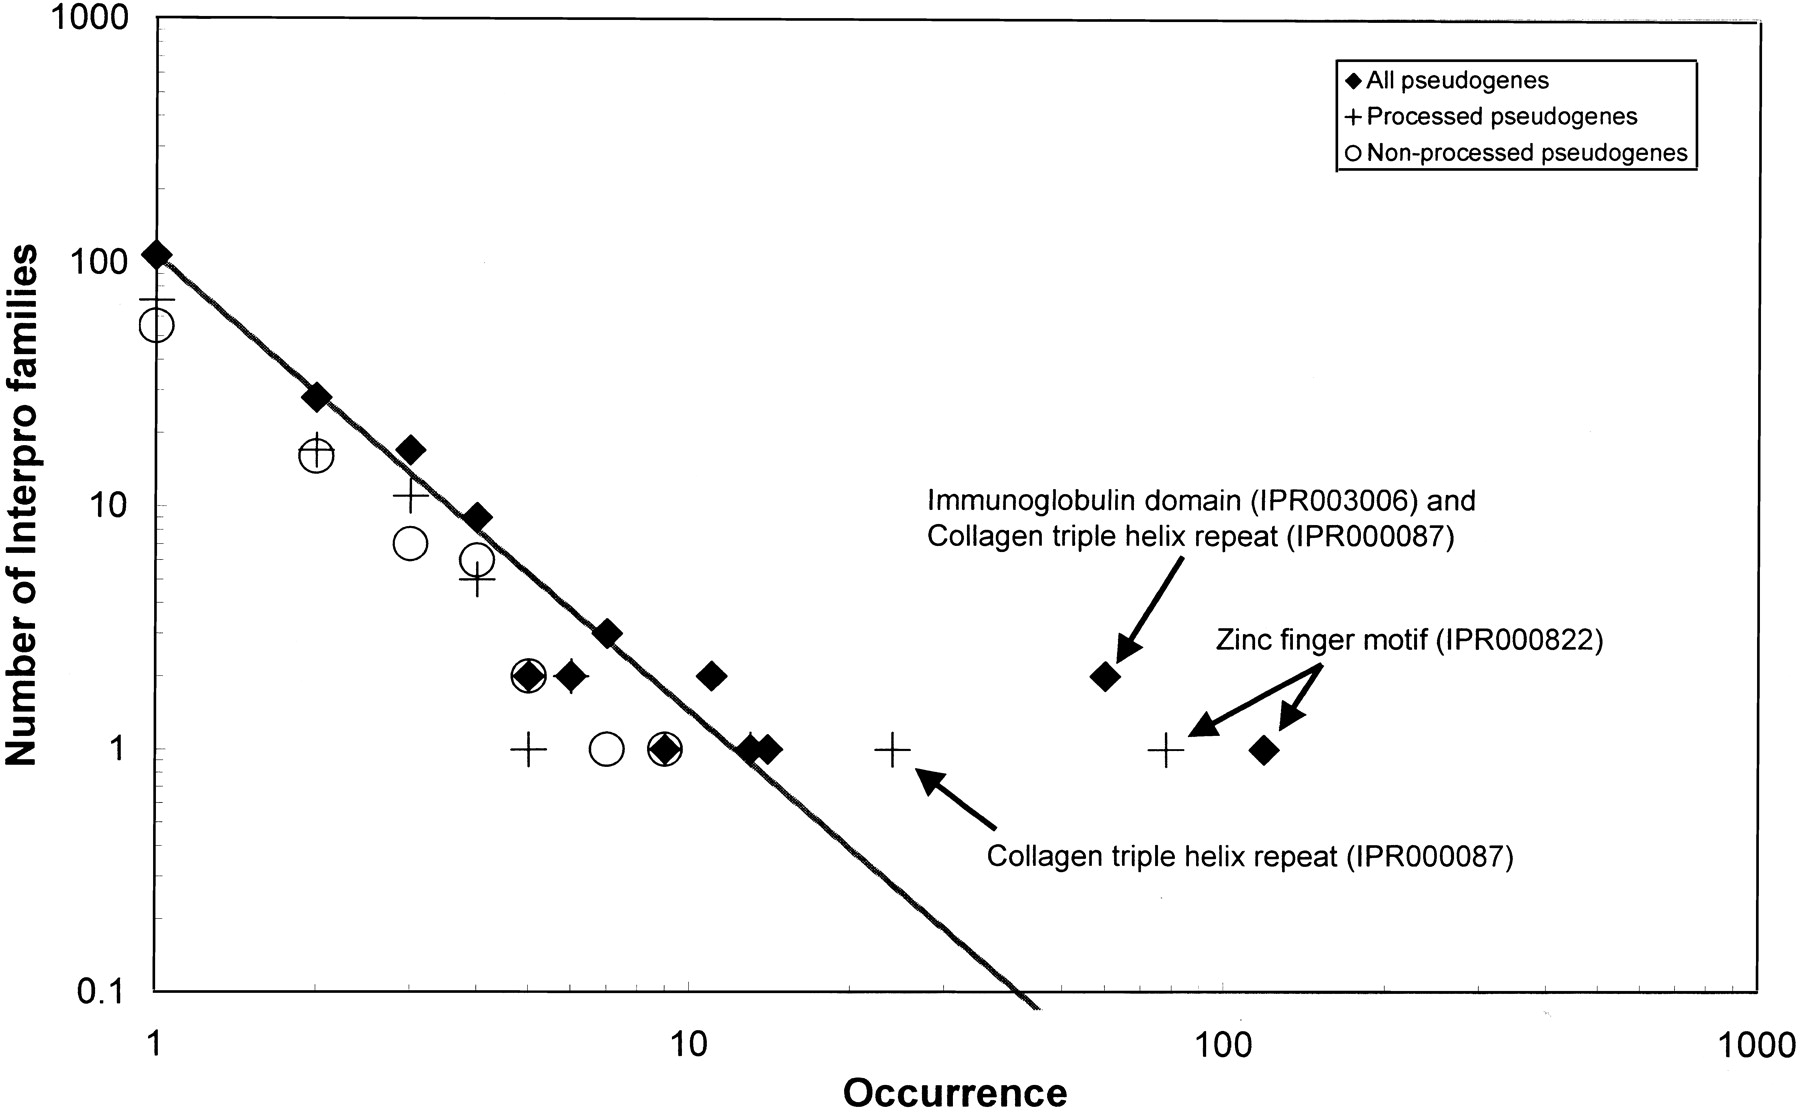
The relationship between the number of InterPro families for pseudogenes and their sizes shows a power–law behavior. The number of InterPro families is plotted vs. the size of a family on a log–log scale. “All pseudogenes” (processed and nonprocessed combined) are plotted with a filled diamond, processed pseudogenes with a cross, and nonprocessed pseudogenes with an unfilled circle. The straight line indicates the best least-squares linear fit to all points for all pseudogenes, except for the outliers that are labeled in the plot. This is indicative of a power–law relationship between the size of a protein family and the number of families that have this size.


