
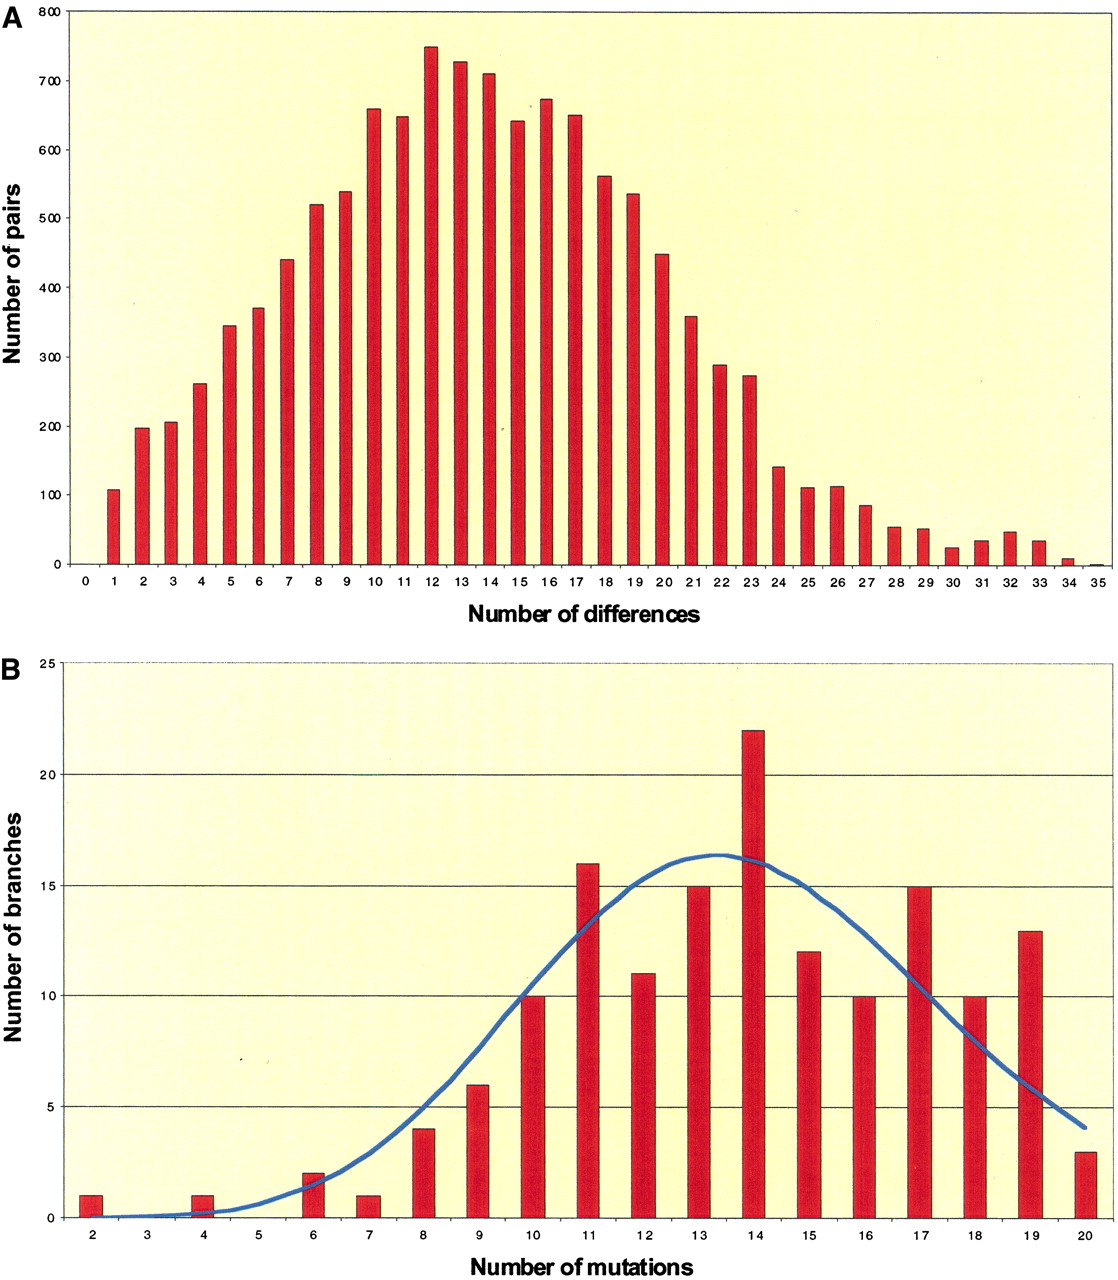
Figure 2.
(A) Pairwise difference distribution among all pairs of YCC haplotypes. (B) Branch length distribution, in number of mutations, from the tree root to each tip. Blue line: Poisson distribution. Both parts of this figure are based on the tree proposed by the Y Chromosome Consortium (2002).


