
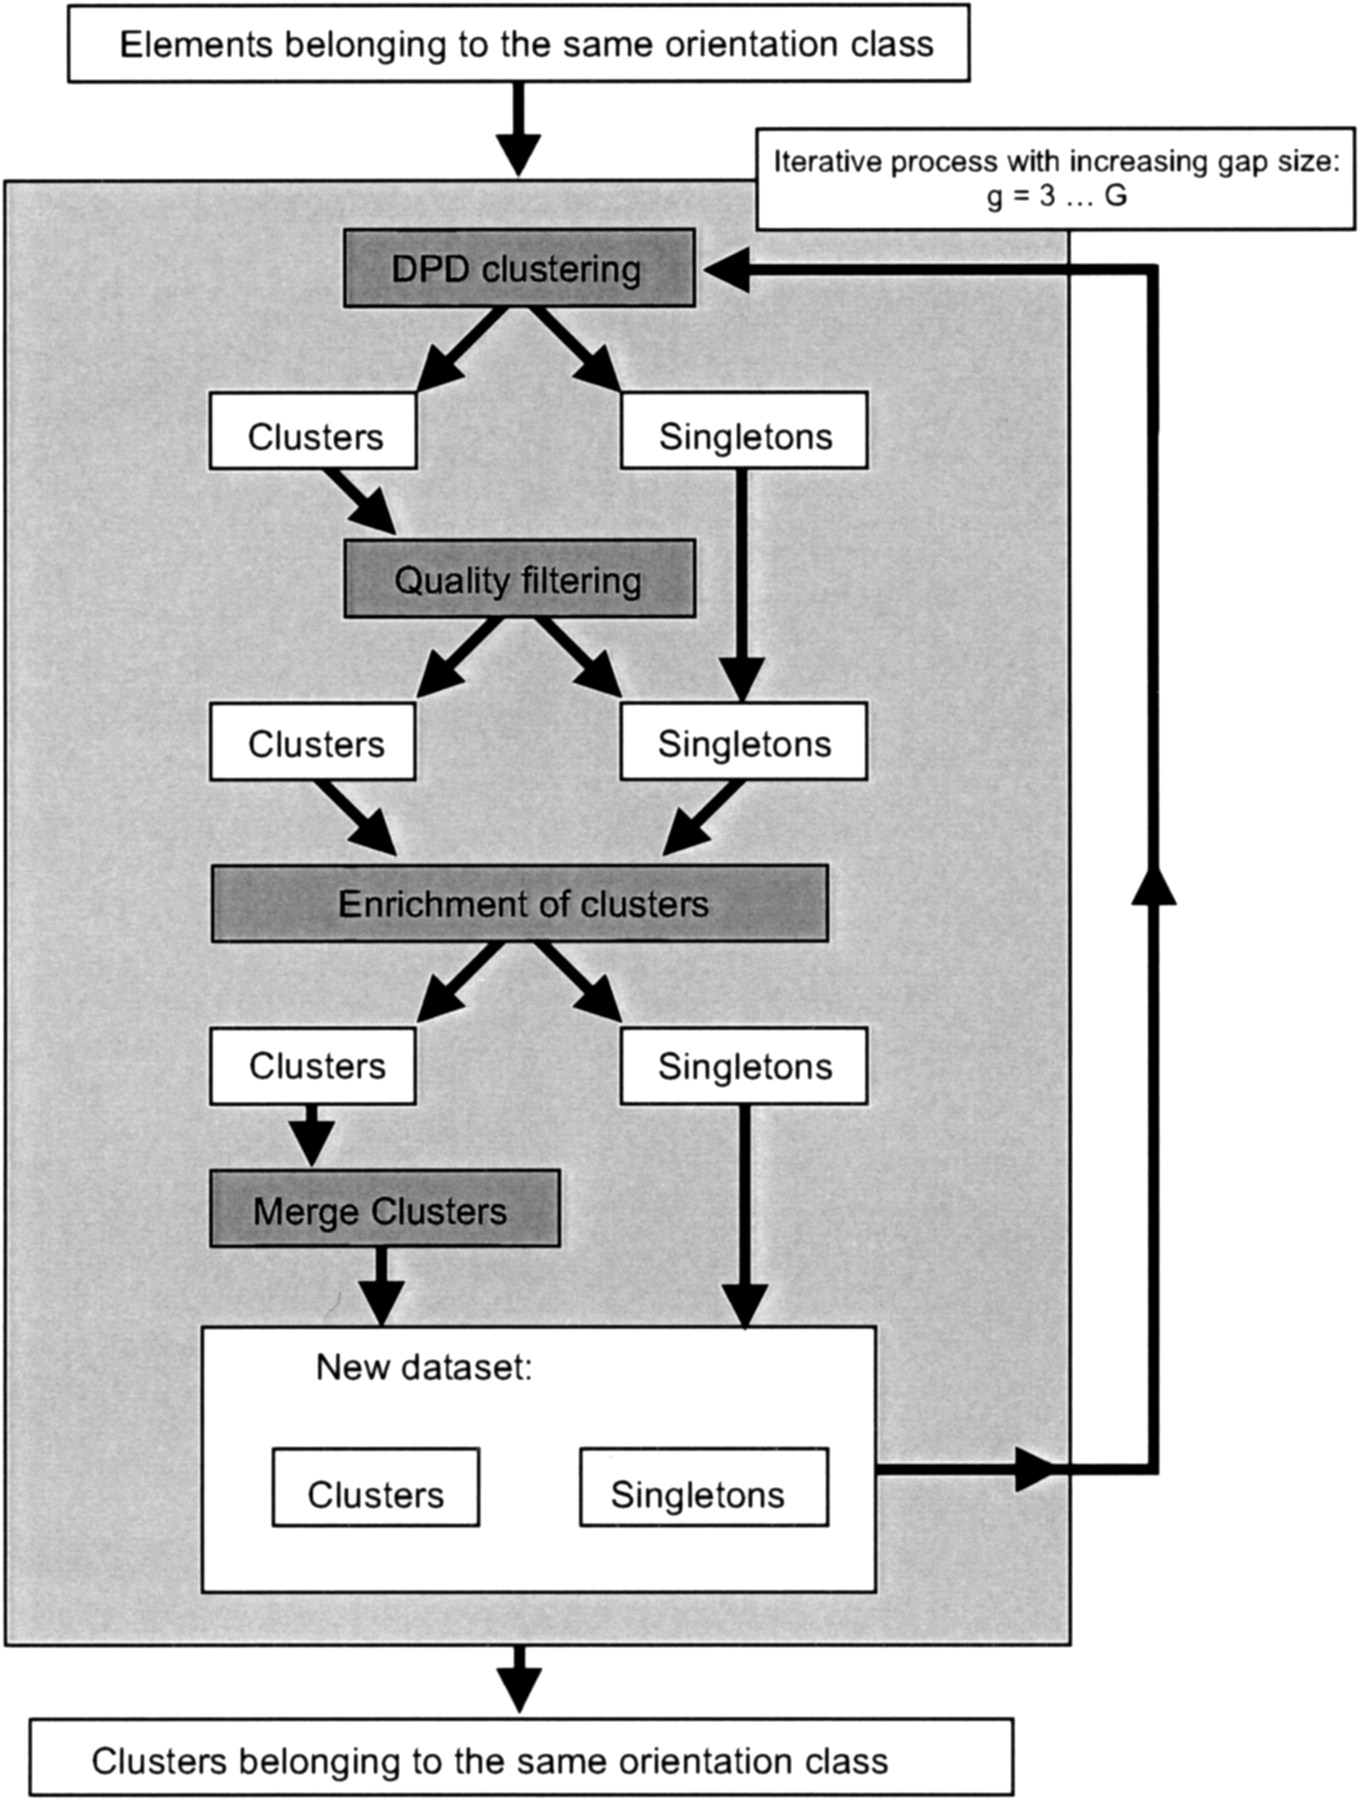
Figure 7.
Flowchart of the ADHoRe core algorithm. Dark gray boxes represent the different steps in the clustering process, white boxes the data items, and the light gray boxes the actions performed during each iteration step. Arrows indicate the dataflow.


