
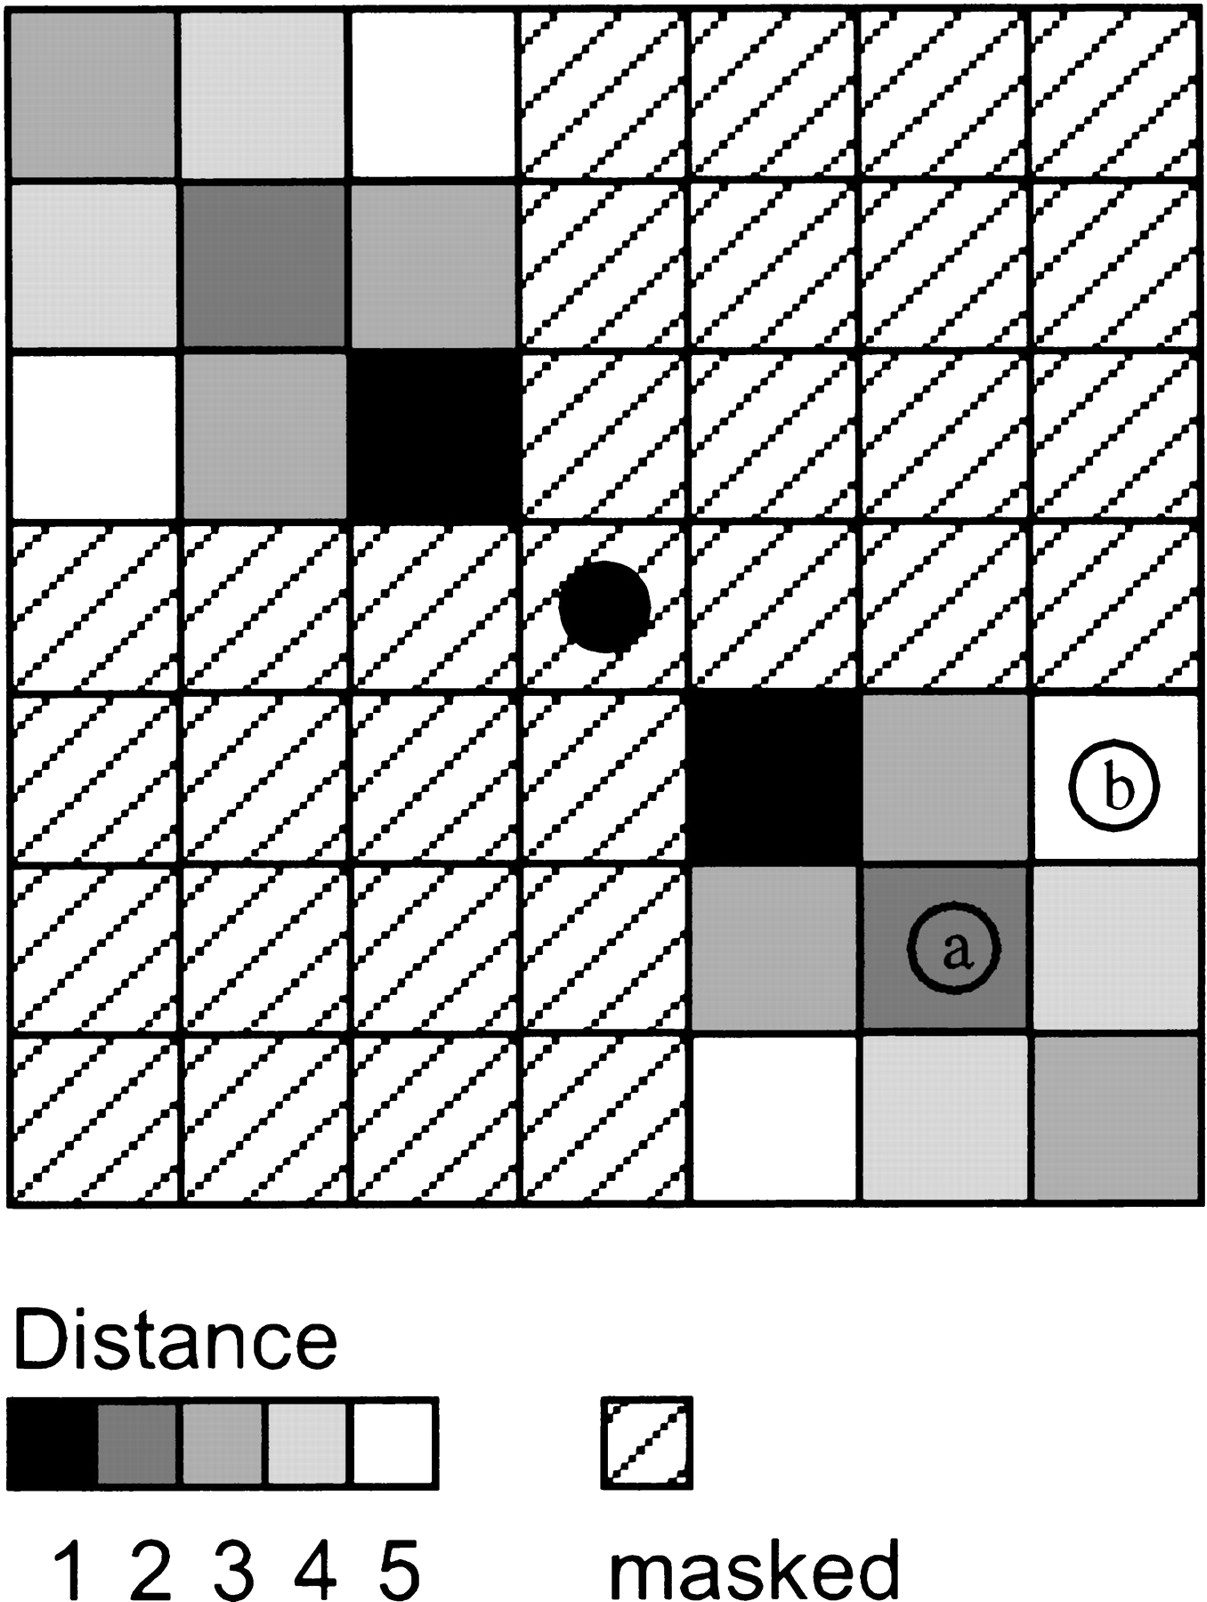
Figure 6.
Graphical representation of the DPD function. Every rectangle represents a cell of the matrix. The central dot corresponds with an element of a cluster. Because the DPD distance to element a is 2 and the DPD distance to element b is 5, a is in closer proximity to the central dot under investigation thanb. According to the orientation class, a specific region of the environment is masked (which corresponds to an infinite distance).


