
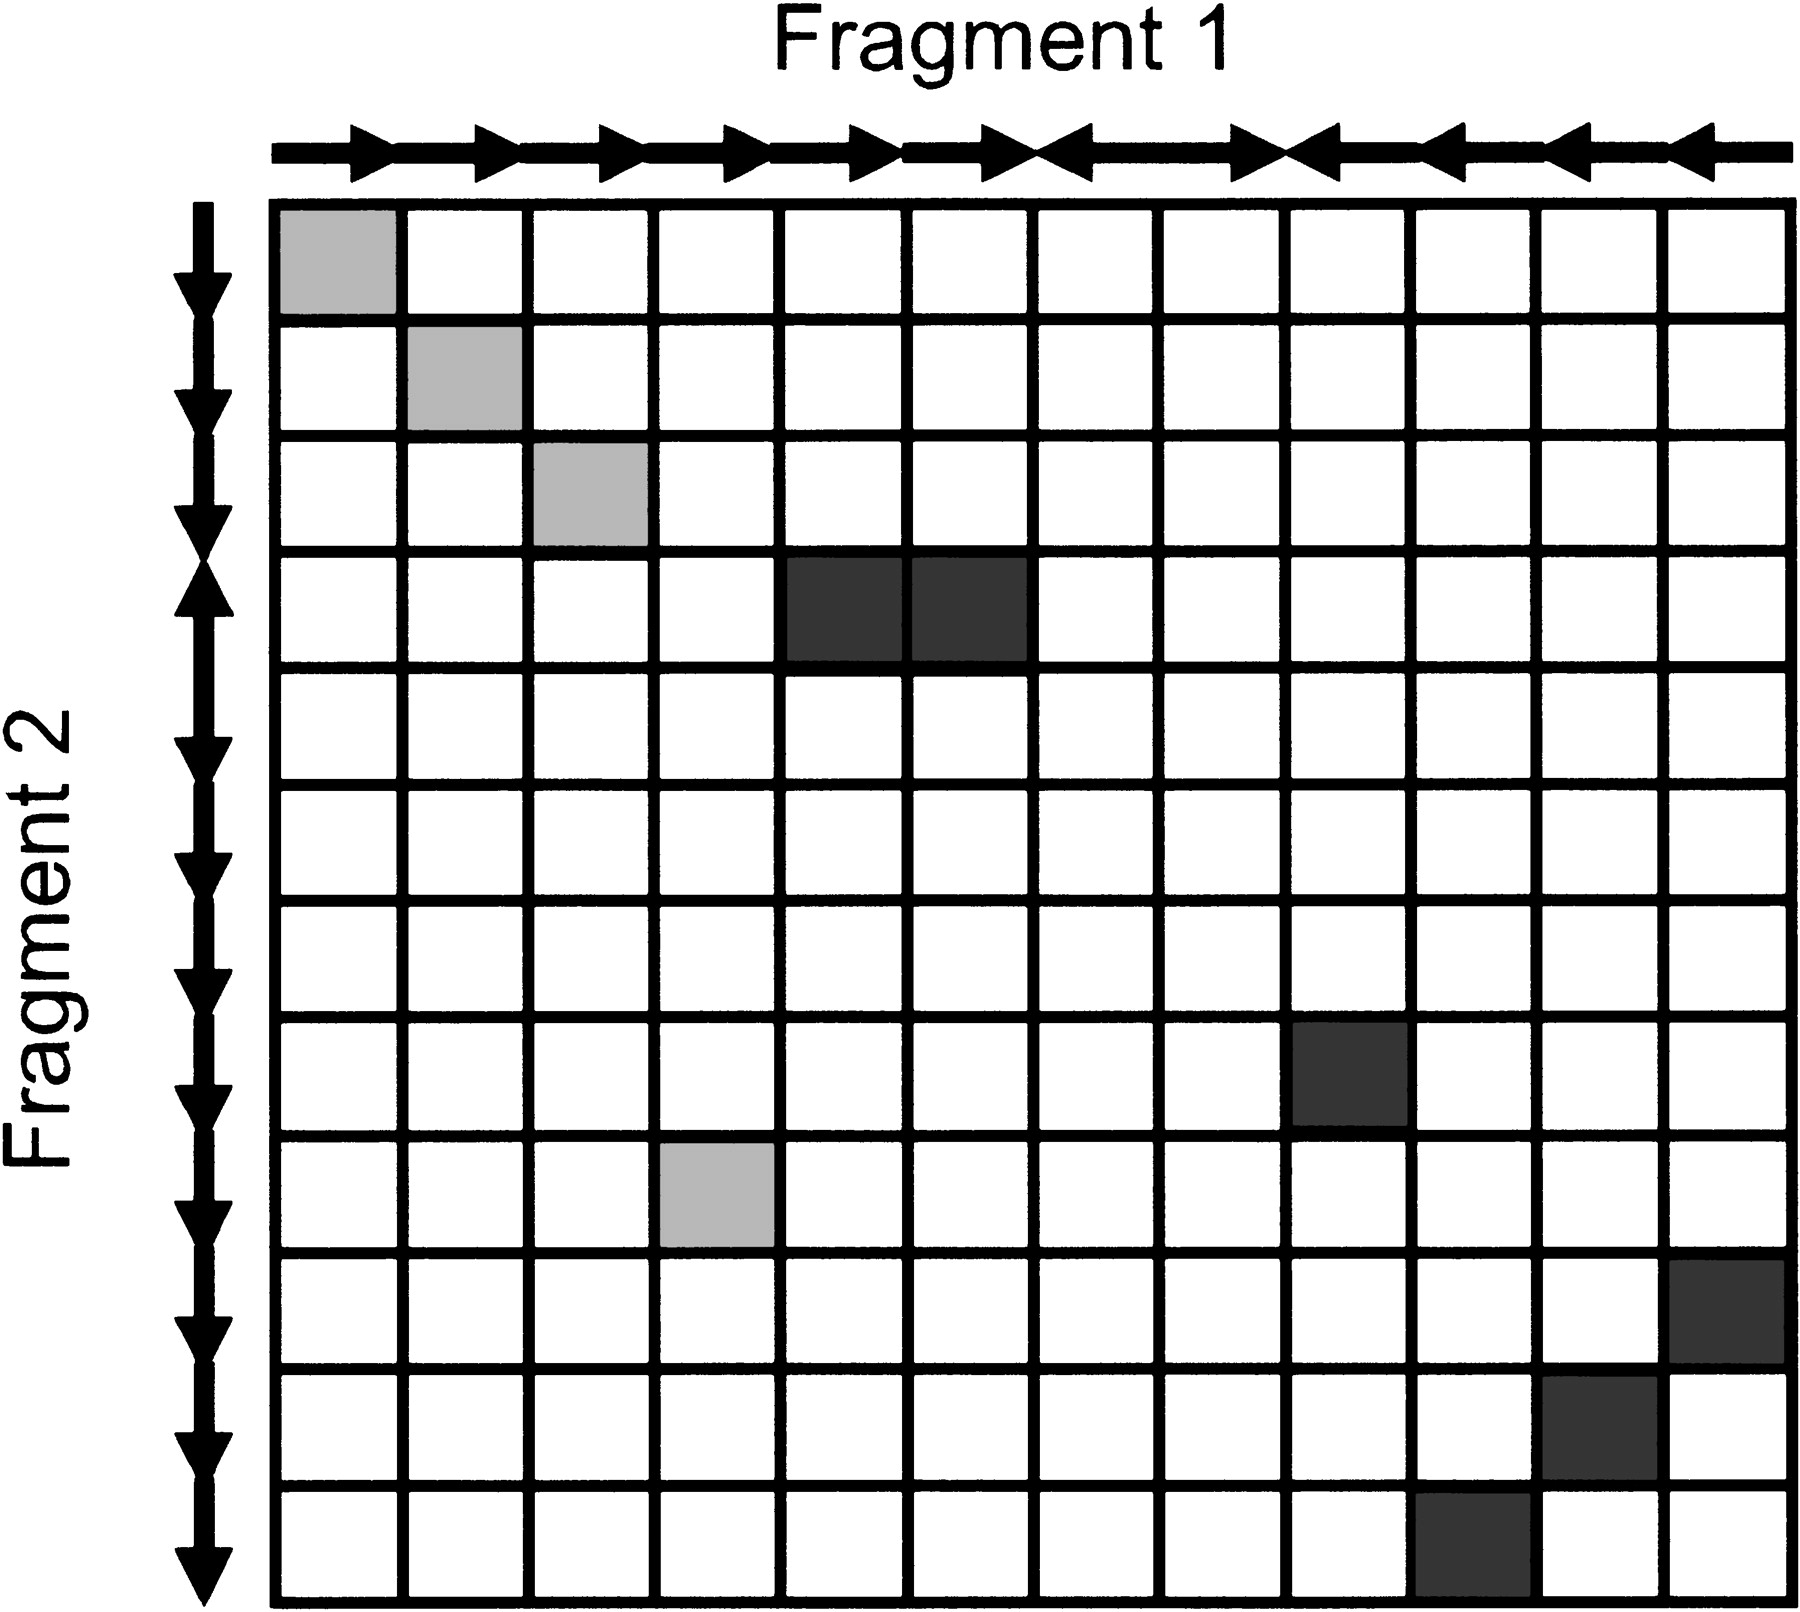
Figure 5.
Matrix representation of homologous genes. Arrows indicate the orientation of the genes on the two genomic fragments compared. Homologous genes with the same orientation are colored in gray; homologous genes with an opposite orientation are in black.


