
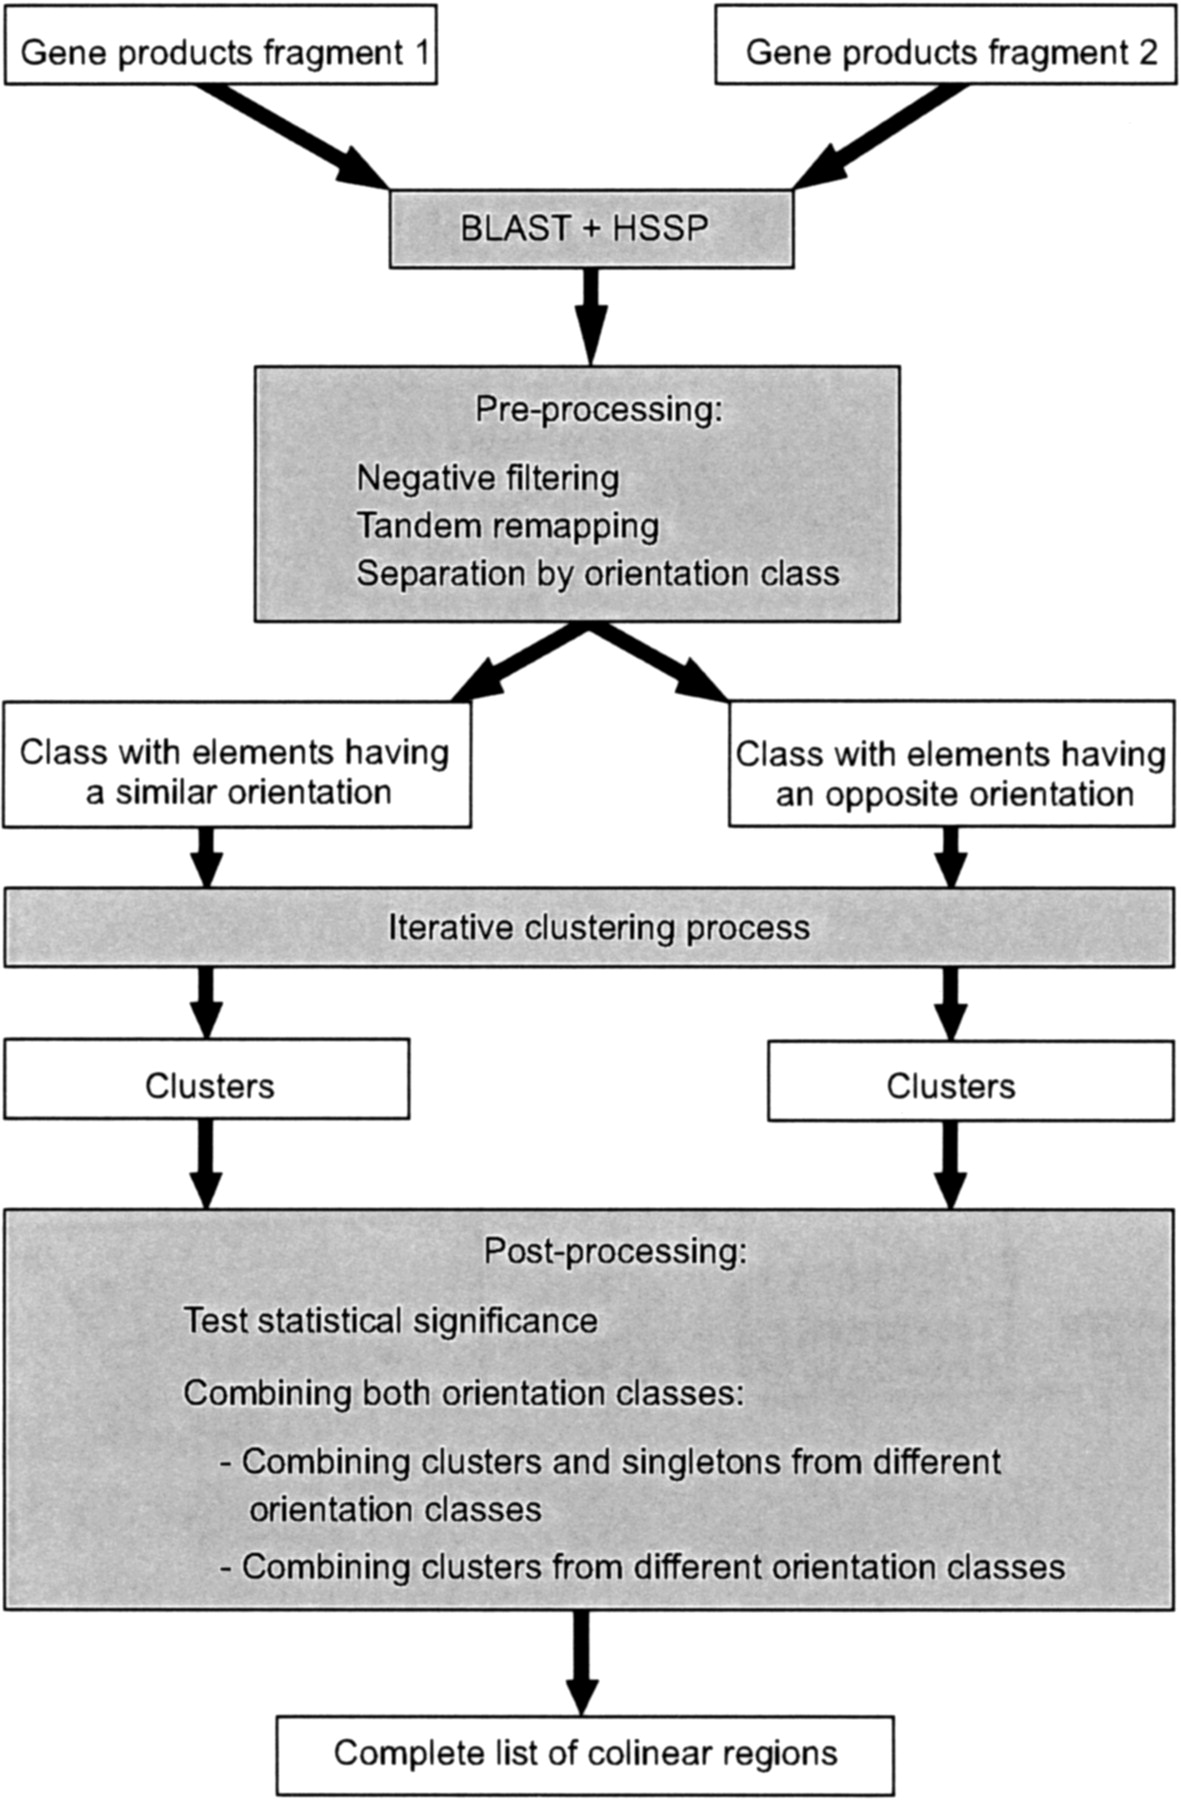
Figure 4.
Flowchart of the ADHoRe strategy used to define colinear regions between two genomic fragments. White boxes represent data items, gray boxes represent routines, and arrows indicate the dataflow.


