
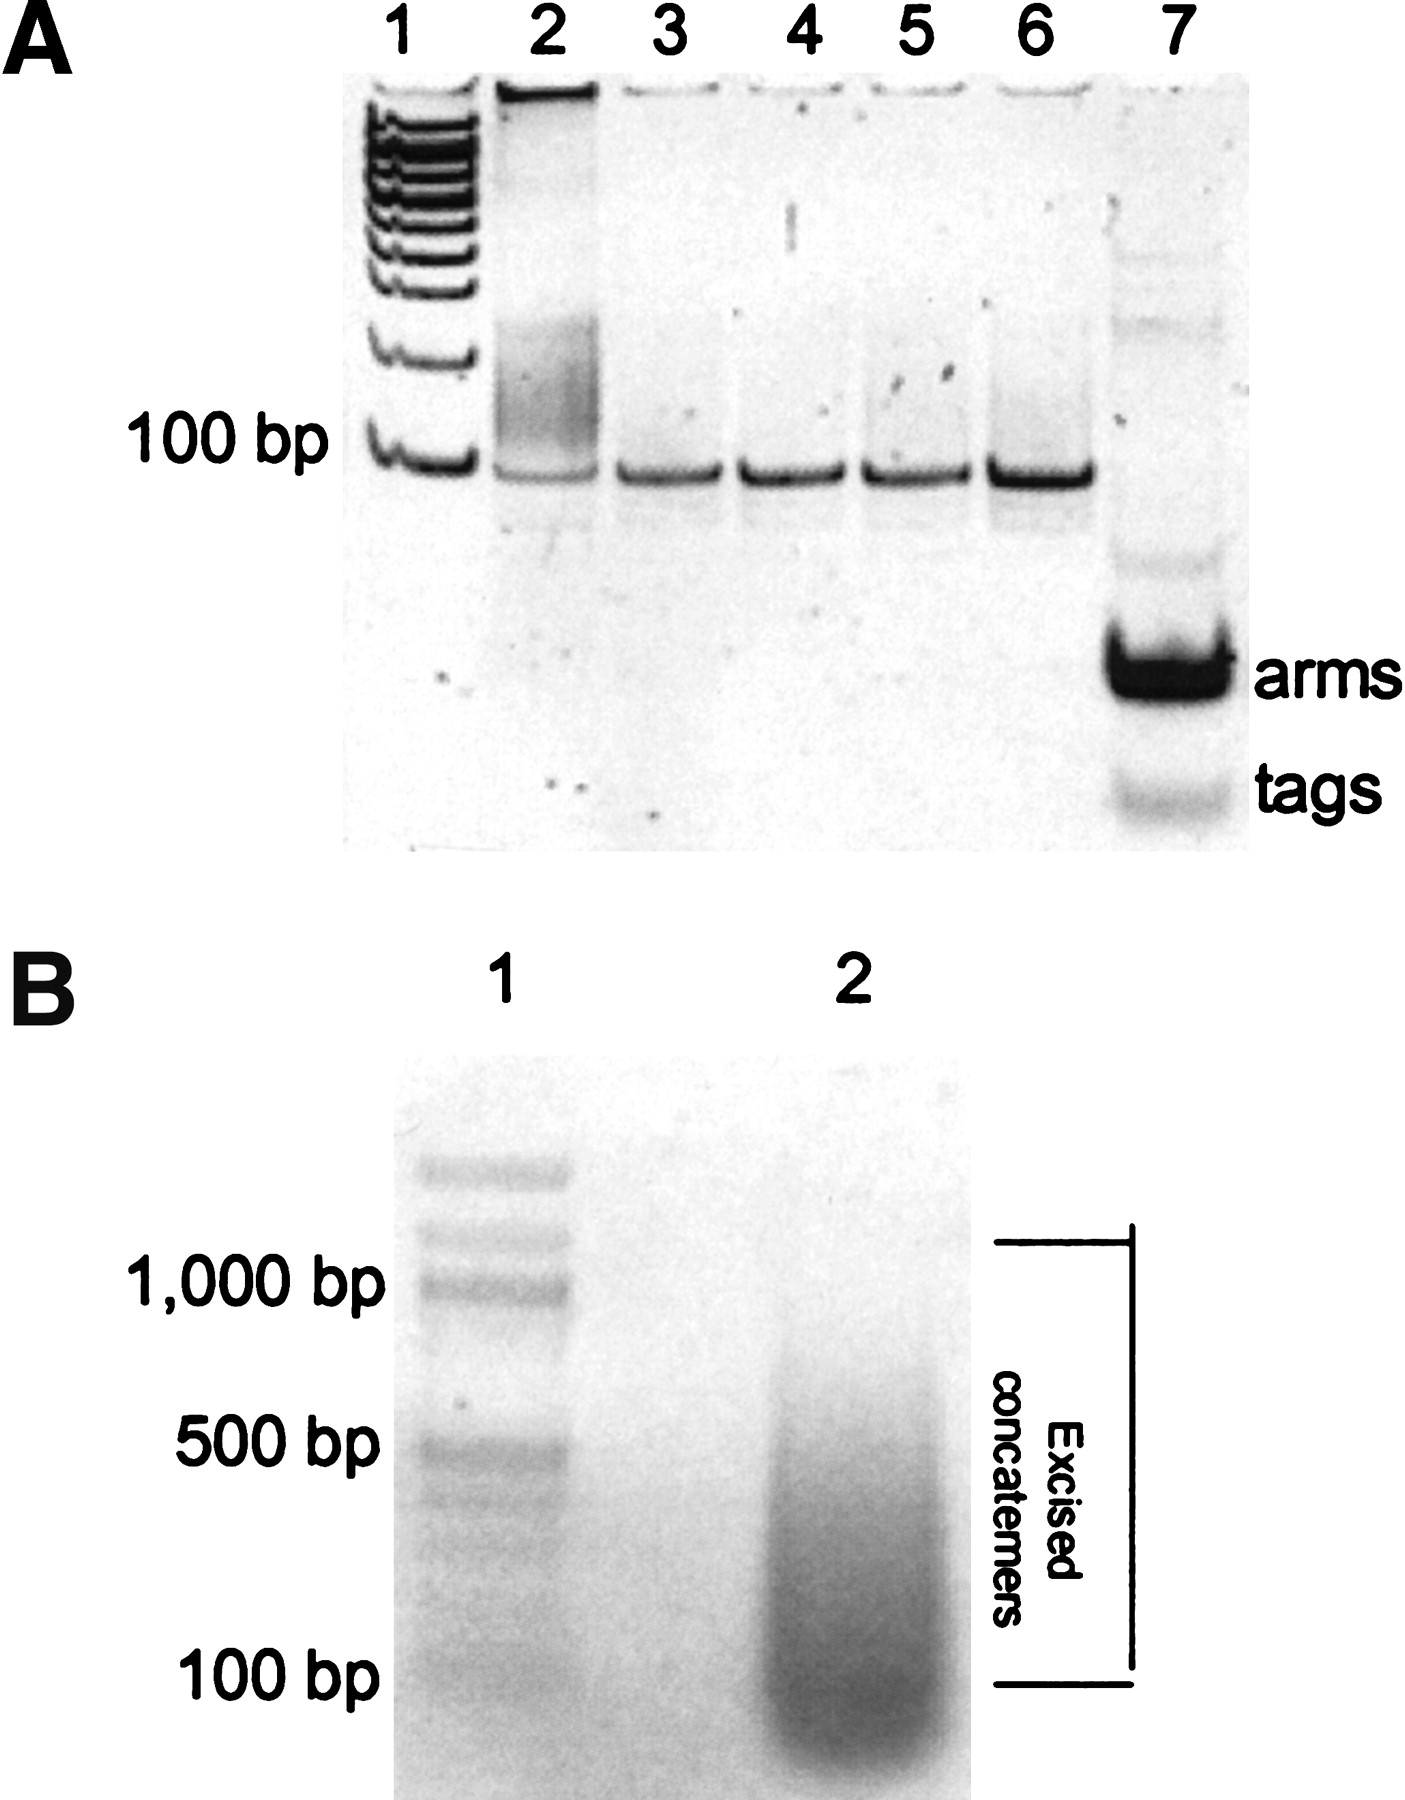
Figure 2.
(A) PCR amplification of GSTs. Samples were electrophoresed on a 10% polyacrylamide gel to show the size distributions of the products after first-round amplification. Lane 1 contains a 100-bp ladder; lanes 2–7, GST samples after PCR amplification, LARHD, LARHD+ExoI digestion, LARHD2, LARHD2+ExoI digestion, and NlaIII digestion, respectively. (B) Concatemer separation. Ligated tags (lane2) were heated to dissociate aggregates (Kenzelmann and Muhlemann 1999) and then sized by agarose gel electrophoresis.


