
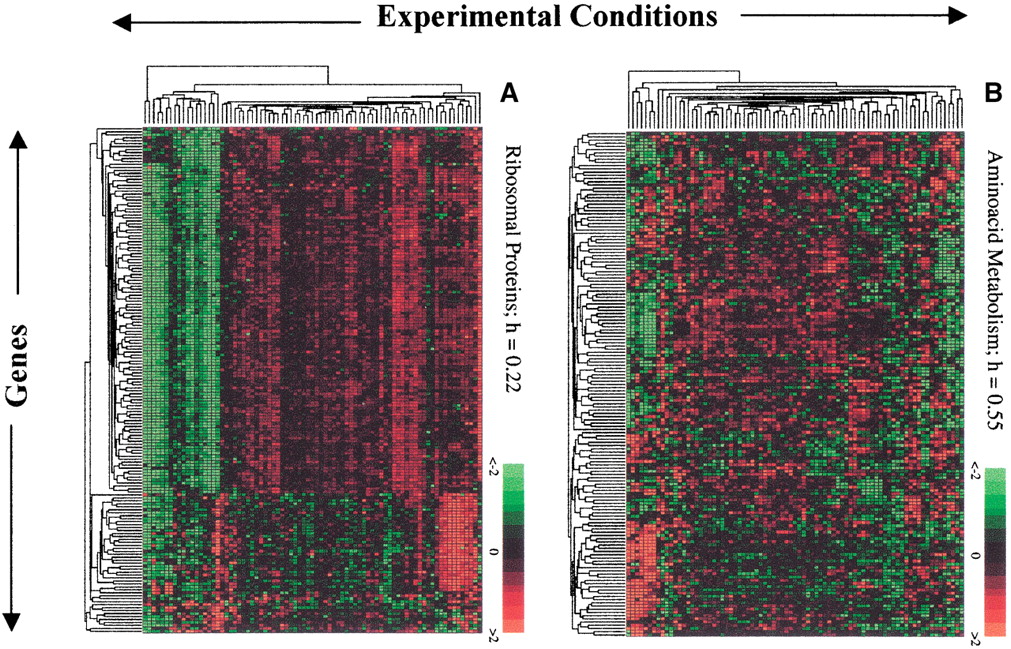
Figure 4.
Eisen plot for two classes: the class of ribosomal proteins (A) and the class of amino acid metabolism (B) containing, respectively, 170 and 157 genes. Rows are genes, and columns are experimental conditions. Both the genes and experimental conditions are reordered according to a hierarchical clustering that puts together genes with expression profiles that are more similar.


