
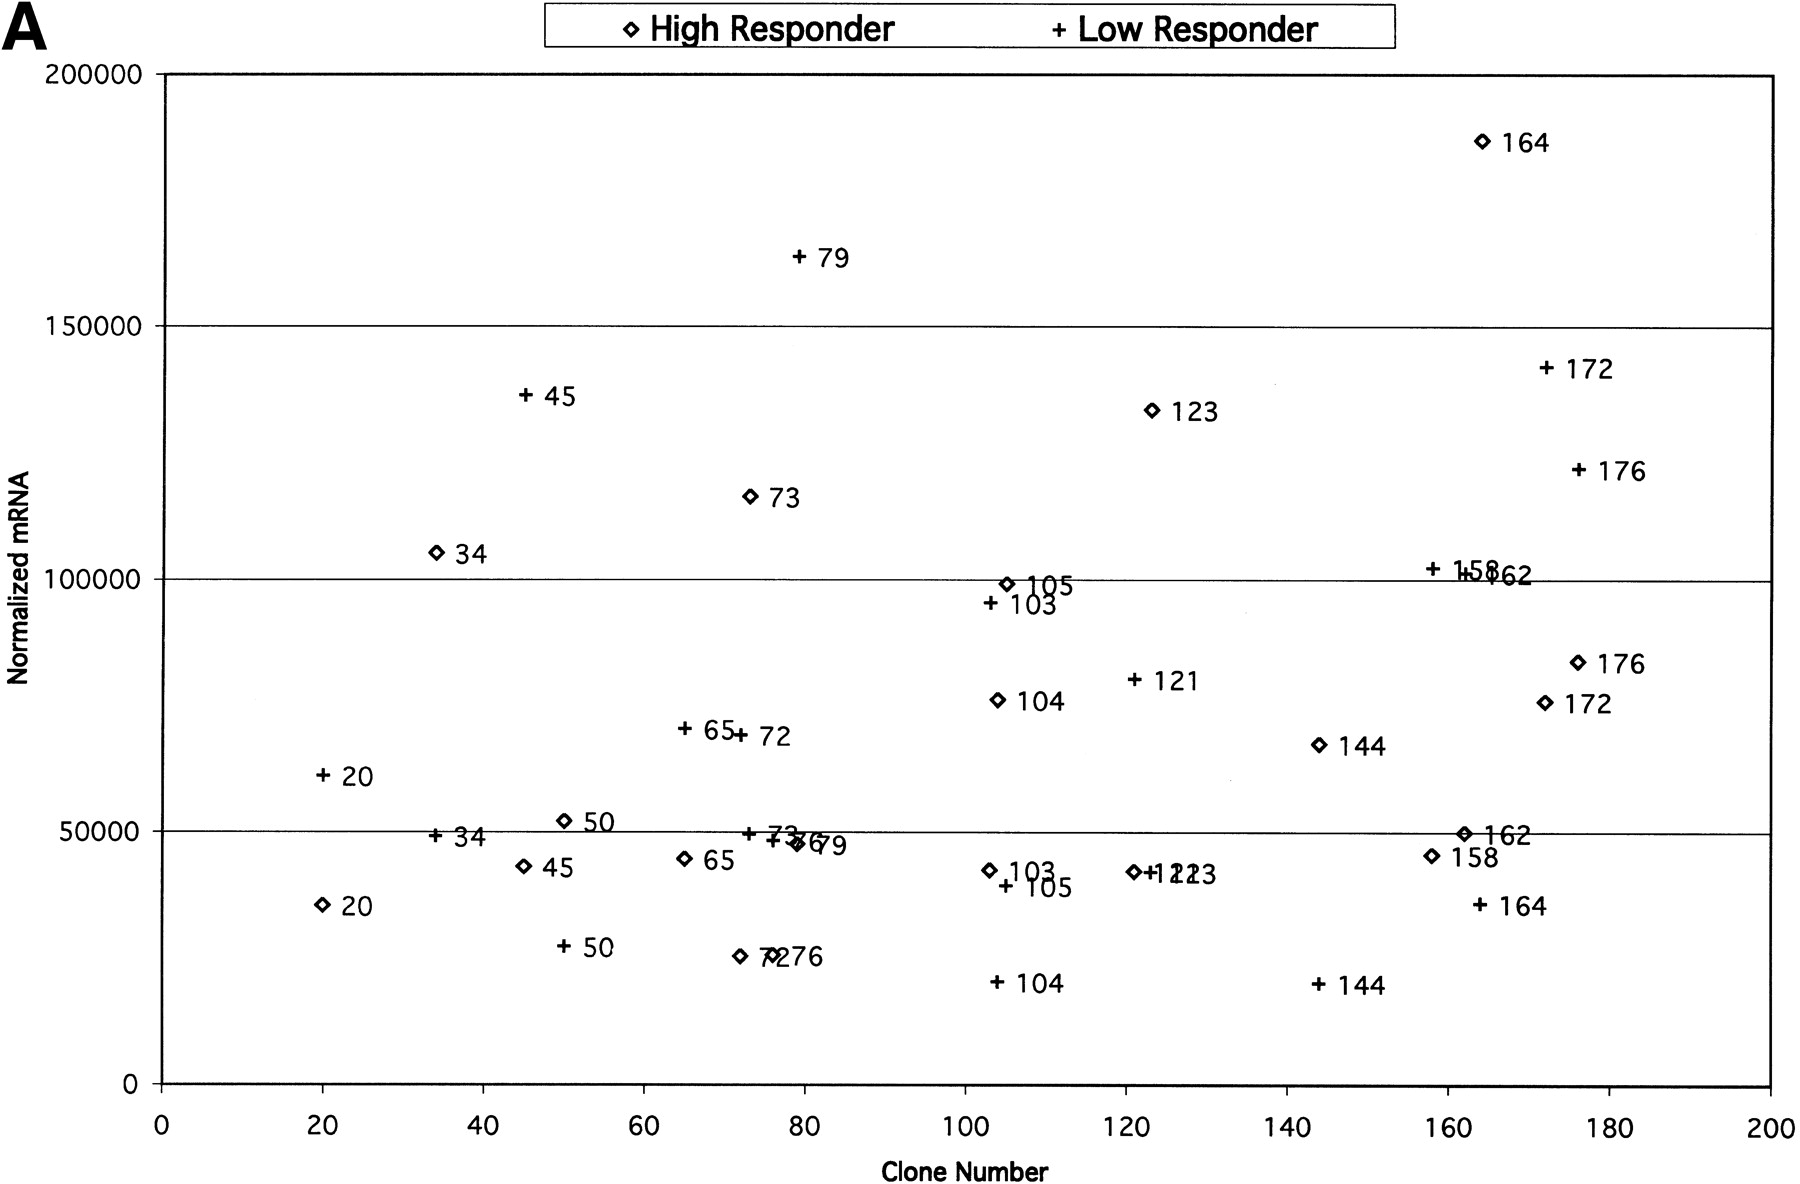
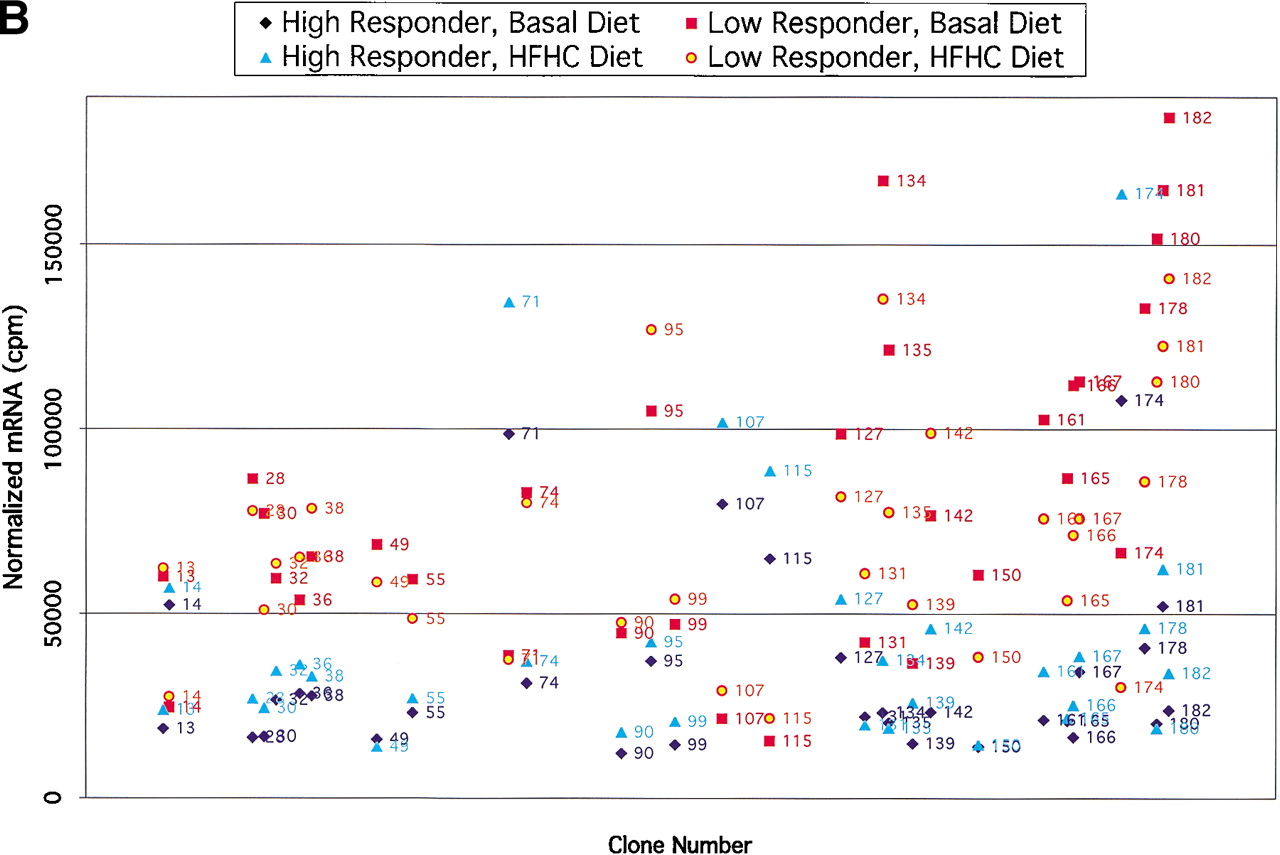
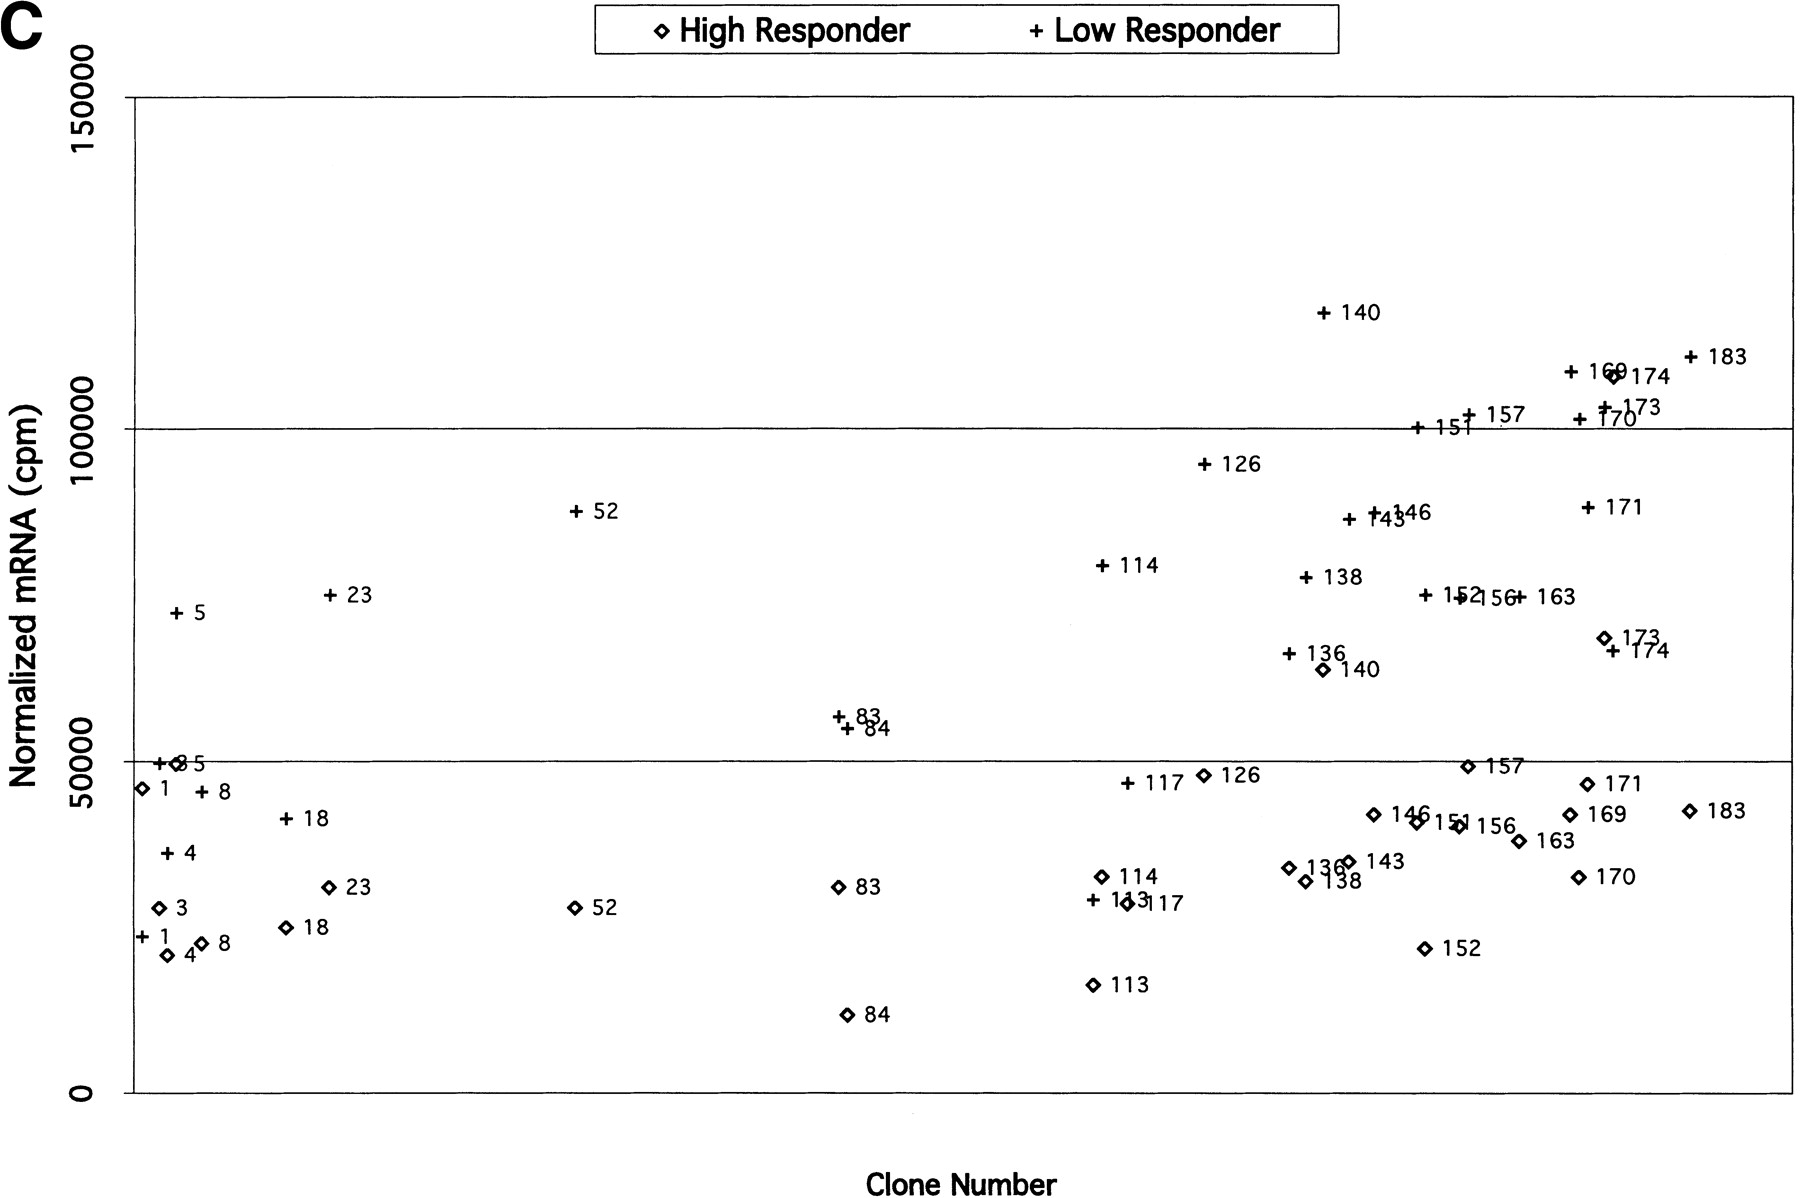
(A) Comparisons of expression patterns in differentially expressed BAC clones for high and low HDL1-C responders on challenge diet. (B) Comparisons of BAC clones that show similar expression patterns on either diet for high and low HDL1-C responders. (C) Comparisons of expression patterns in BAC clones for high and low HDL1-C responders on basal diet. Eight baboons were screened for gene expression from liver biopsies sampled while the animals were on the basal diet and while the animals were on the challenge diet. Each data point represents an average of duplicate measures for all animals in that phenotypic group for that BAC clone. BAC clone numbers represent the series number assigned to that BAC clone in the contig. Clone number 1 is the most p-ter clone in the contig and clone 183 is the most q-ter clone in the contig. Clones showing expression differences greater than ± one standard deviation were considered differentially expressed. Clones that were not expressed above levels of the negative controls and clones that did not contain differentially expressed genes are not shown.


