
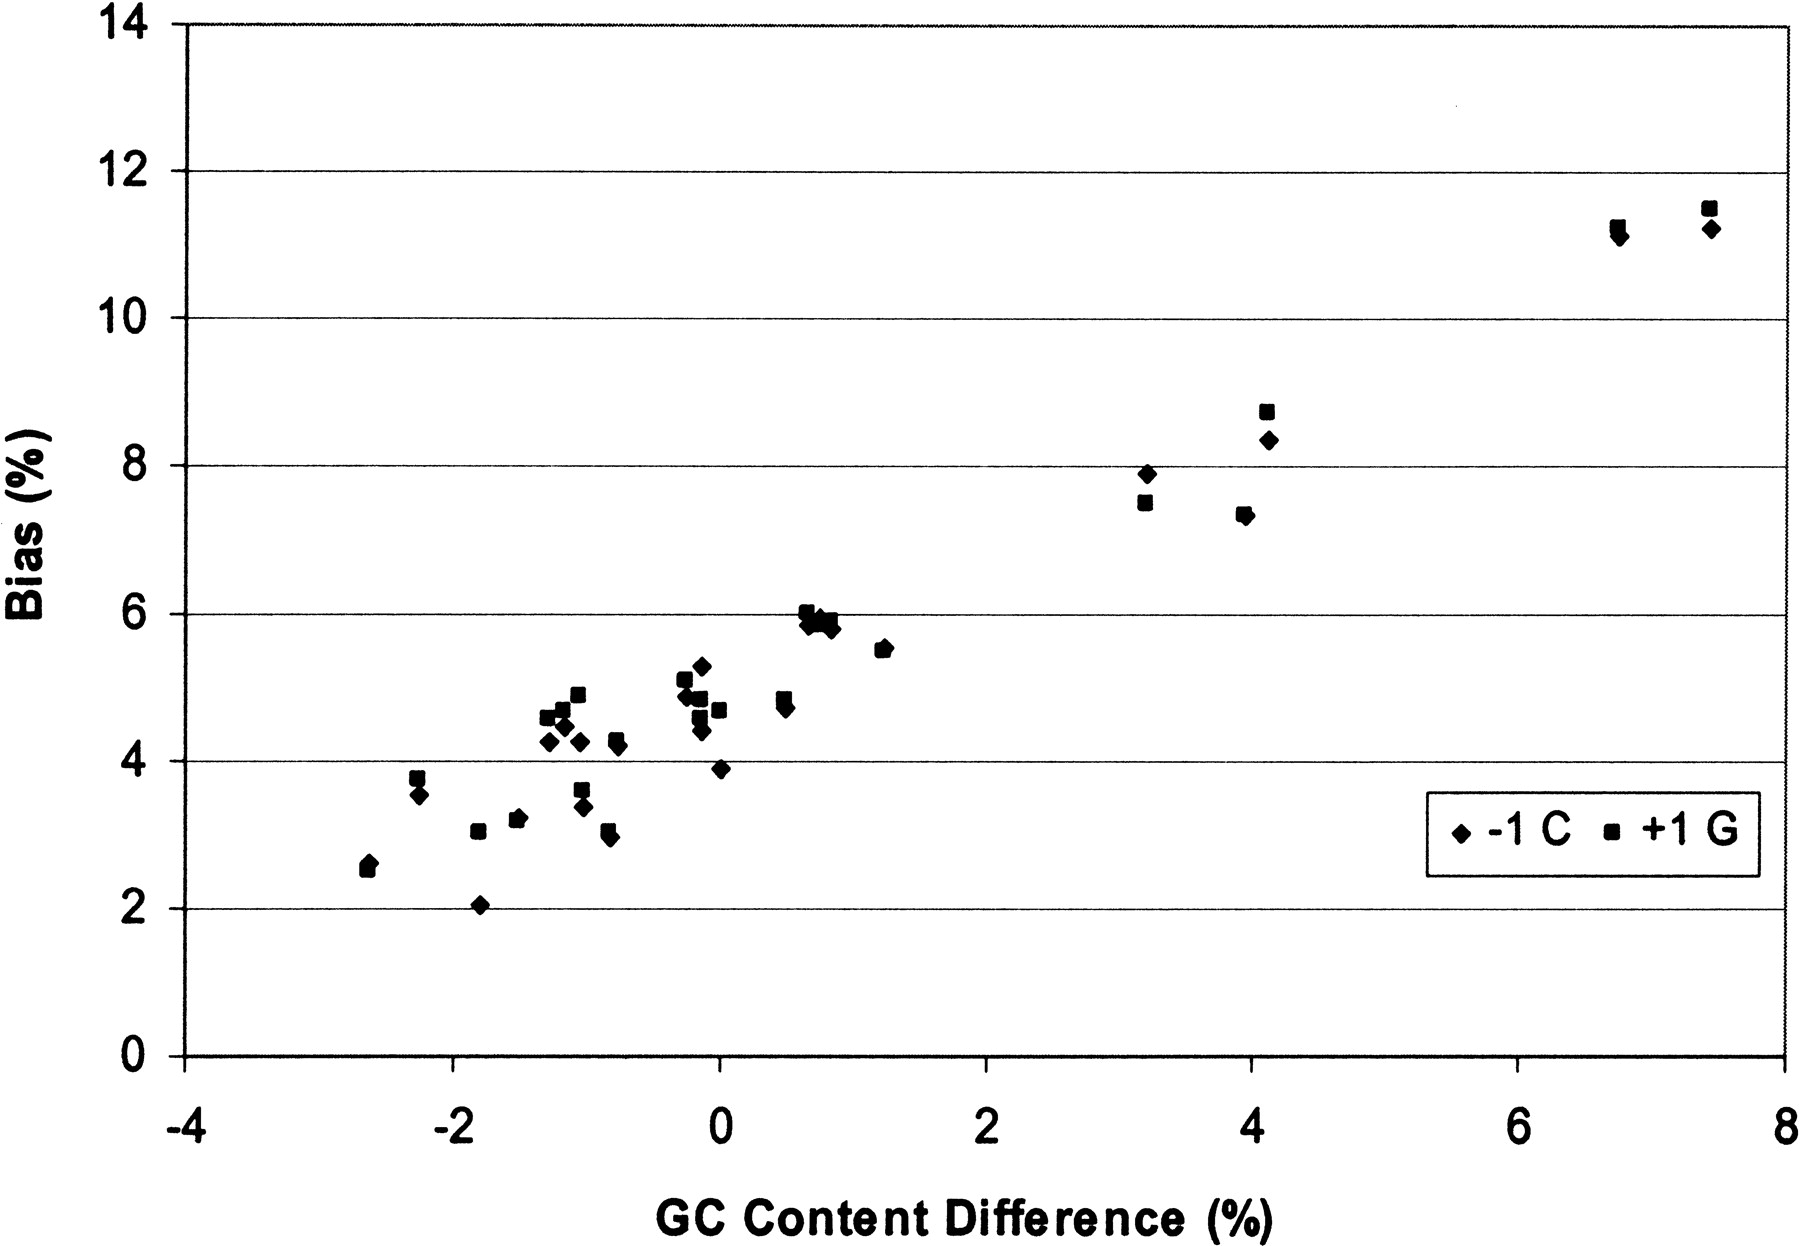
Figure 3.
Linear correlation between the GC content difference from the genome average and the proportion of bias at −1 C and +1 G observed on each chromosome.
(Downloading may take up to 30 seconds. If the slide opens in your browser, select File -> Save As to save it.)
Click on image to view larger version.
Linear correlation between the GC content difference from the genome average and the proportion of bias at −1 C and +1 G observed on each chromosome.
 CiteULike
 Delicious
 Digg
Digg Facebook
 Google+
 Reddit
 Twitter
