
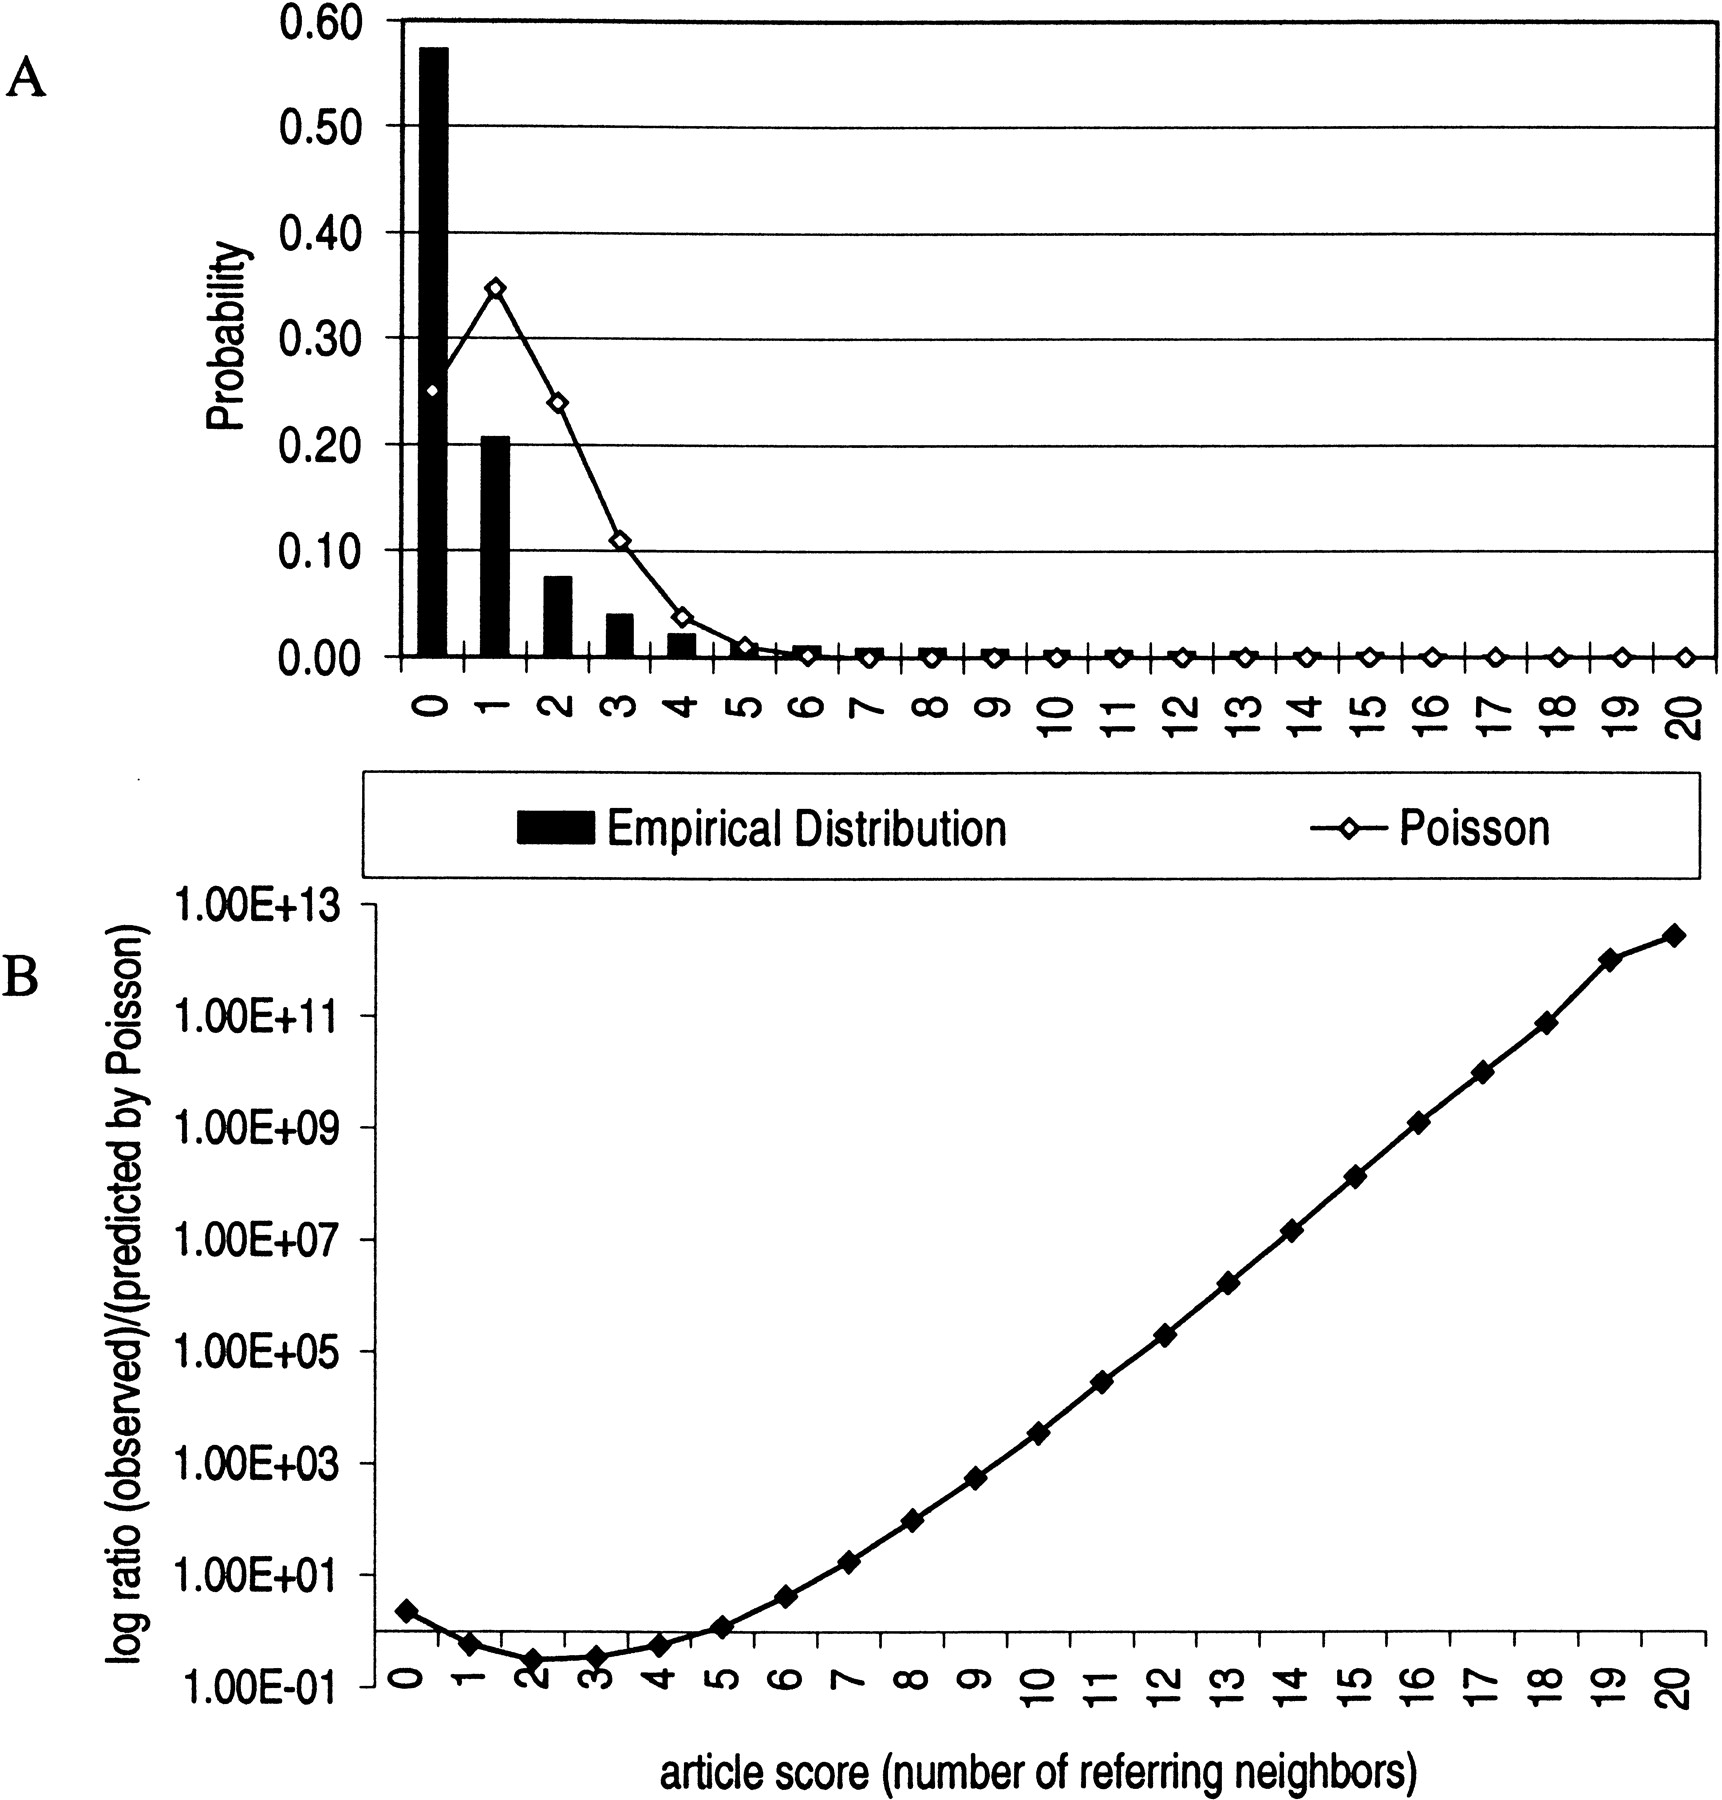
Observed and expected distribution of article scores. (A) The bar graph in the figure represents the observed empirical distribution of article scores for the “signal transduction” gene group. The line on the figure is the Poisson distribution; it is the expected distribution of scores for a random gene group of the same size. (B) The ratio in log scale of observed (bars in Fig. 4A) to expected (line in Fig. 4A) distribution of article scores. TheX-axis is drawn at a ratio of one, where observed is equal to expected. Because the gene group represents a well-defined biological function, the distributions are very different. High-scoring articles that discuss signal transduction and low-scoring articles that discuss functions besides signal transduction are overrepresented.


