
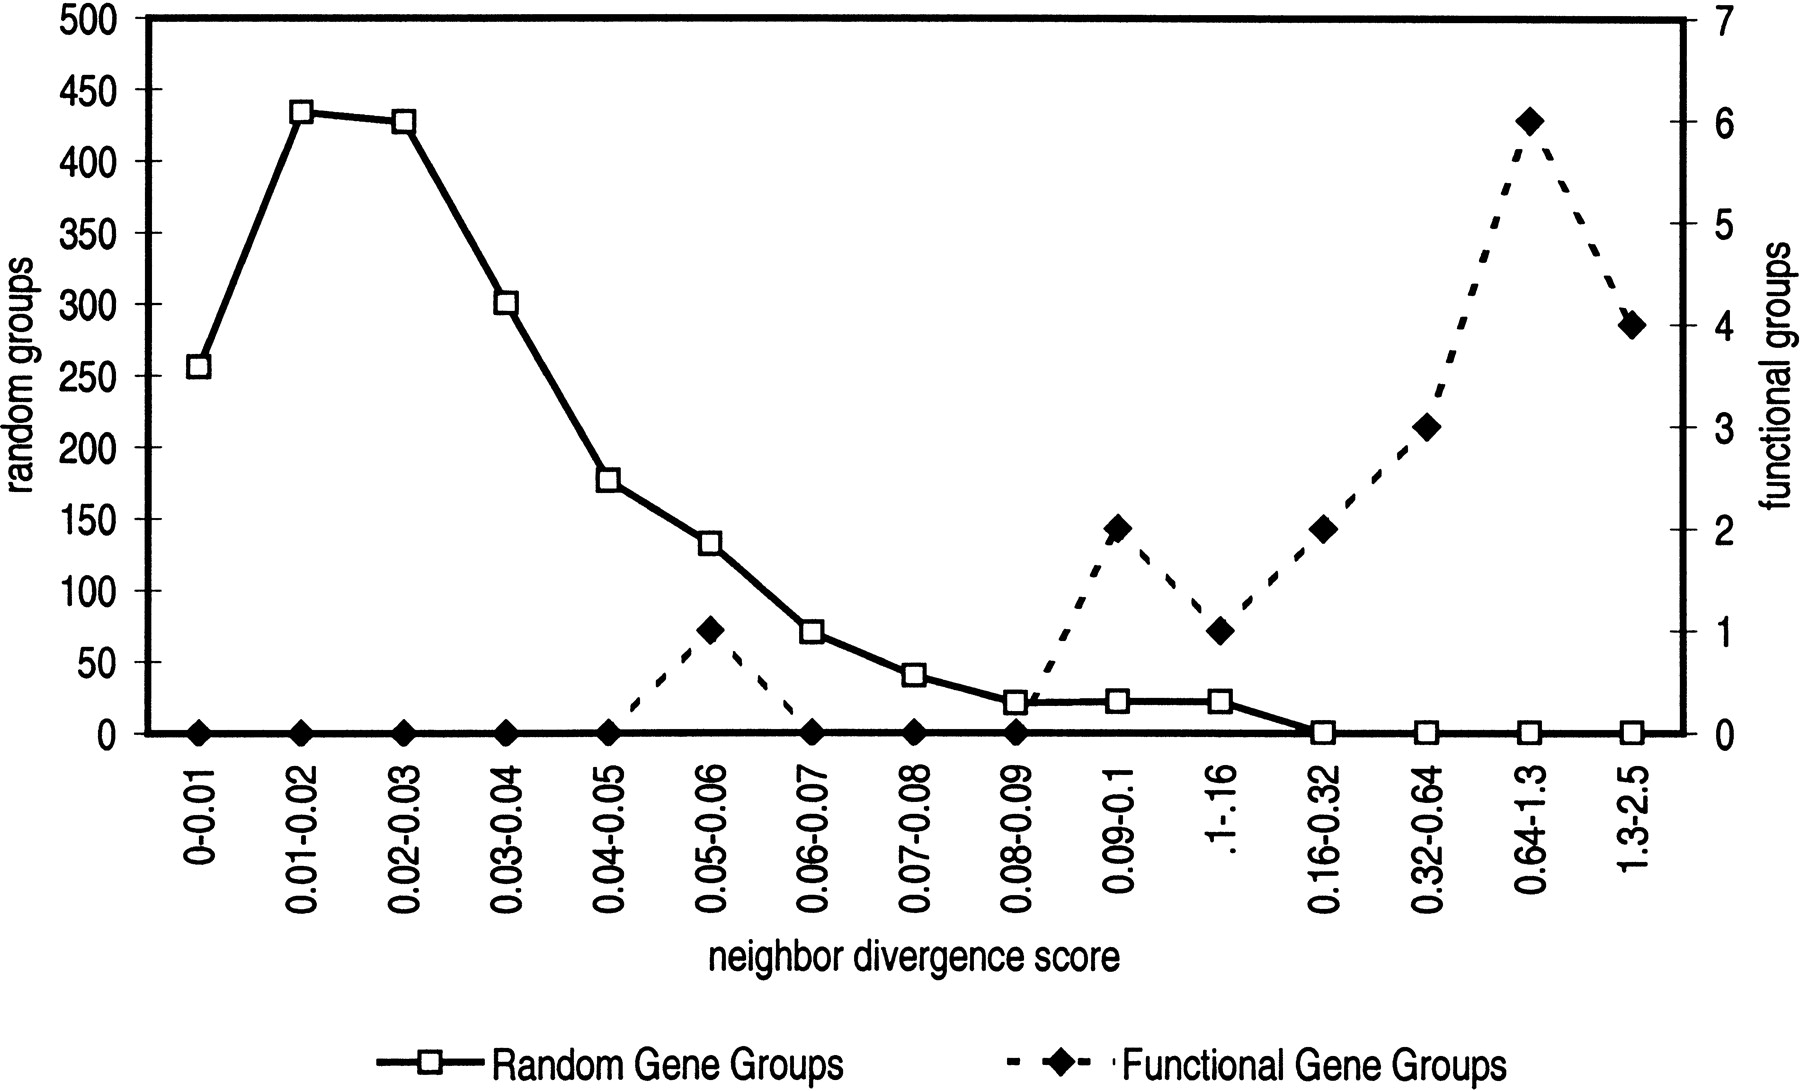
Figure 3.
Histogram of neighbor divergence scores. Each open square represents (≤) the count of random gene group scores in the range indicated on the horizontal axis; each closed diamond represents the count of functional gene group scores in the range on the horizontal axis. There is little overlap between the two histograms. None of the random gene groups score above .16; most of the functional gene groups score well above .16.


