
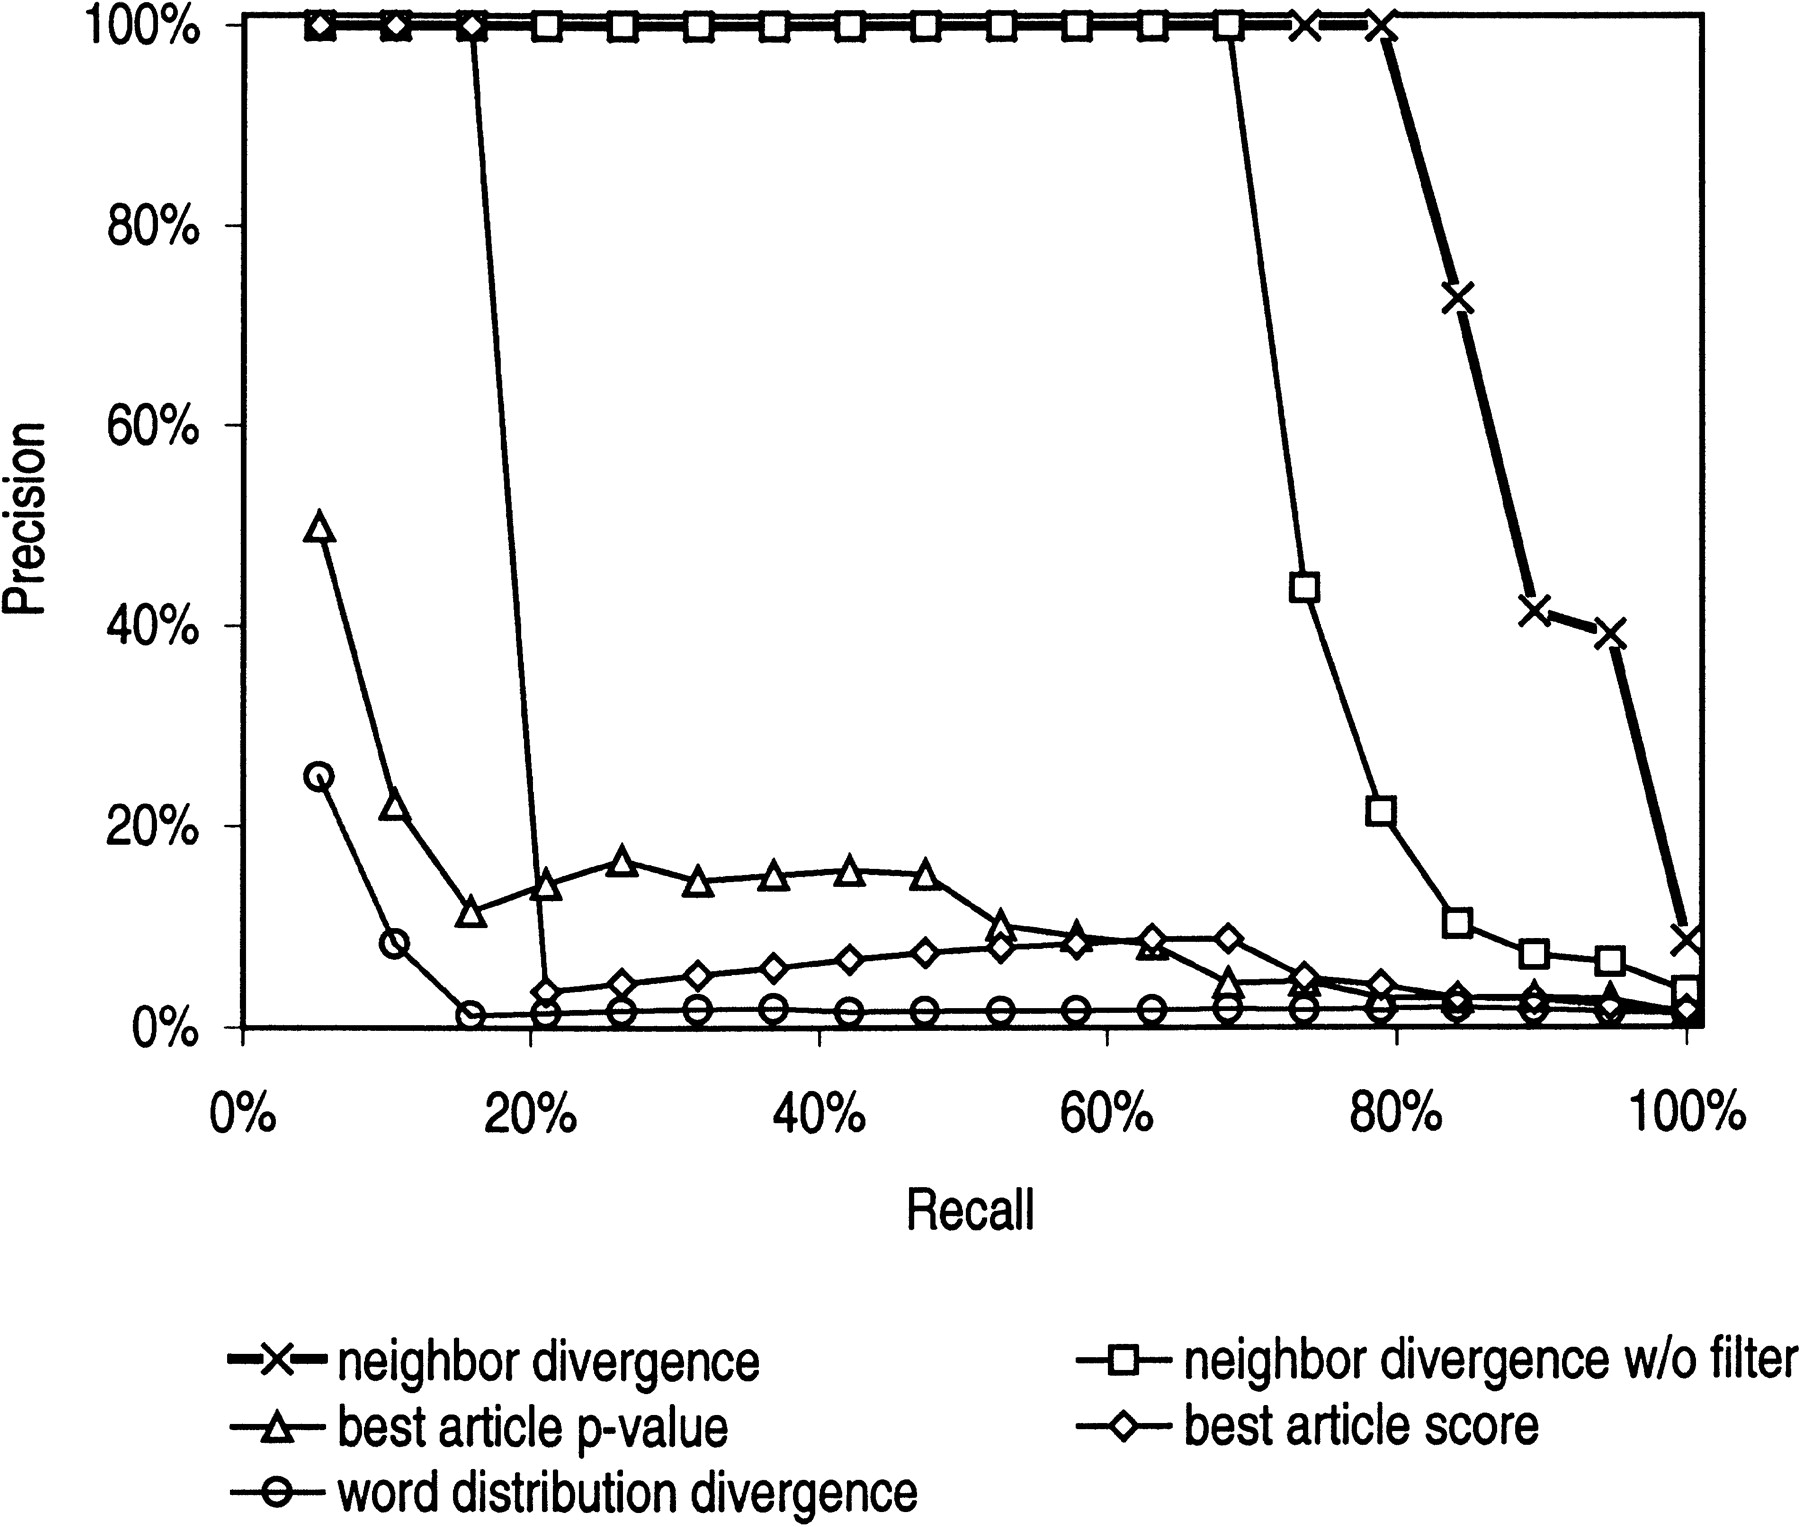
Precision-recall plot for each of the functional coherence scoring methods. We used each method to score the functional coherence of the 19 functional gene groups and the 1900 random gene groups. We calculated and plotted precision and recall at cutoff scores of different stringency. There is a trade-off between precision and recall. More stringent cutoff values select fewer true functional groups, and recall (or sensitivity) is compromised; however, less stringent cutoff values cause many random groups to be selected inappropriately and precision is compromised. An ideal precision-recall plot achieves 100% precision for every value of recall. The neighbor divergence method is closest to the optimal curve.


