
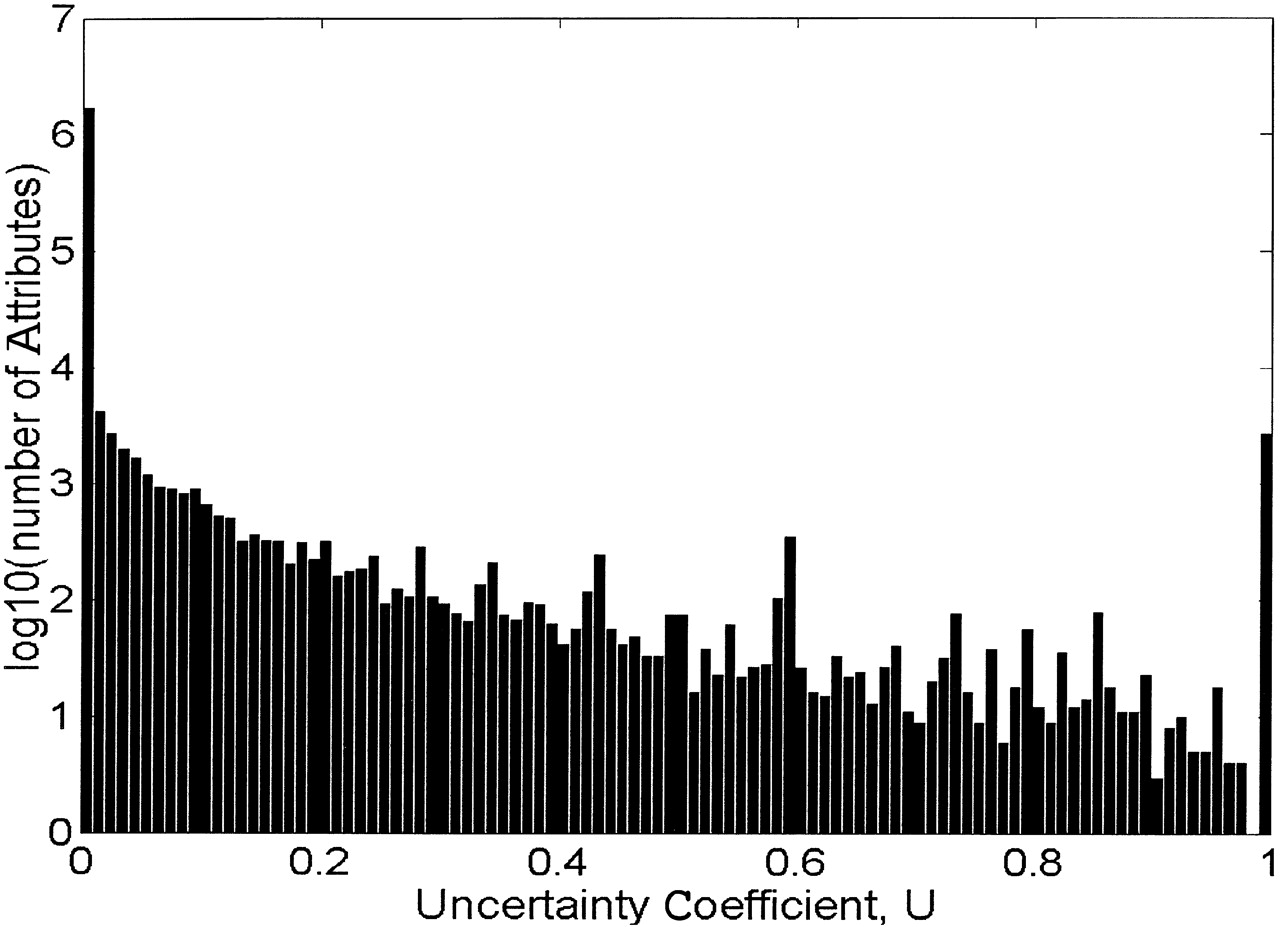
Figure 5.
U for all attribute pairs, after removing one of each pair with U > 0.9999. Histogram showing uncertainty coefficient between all pairs of attributes, after removing one of each pair withU > 0.9999. When a pair of attributes has U = 0, there is no correlation between possession of one attribute by a gene, and possession of the other. When U = 1.0, they are completely correlated: if a gene has one attribute, it will certainly also have the other.


