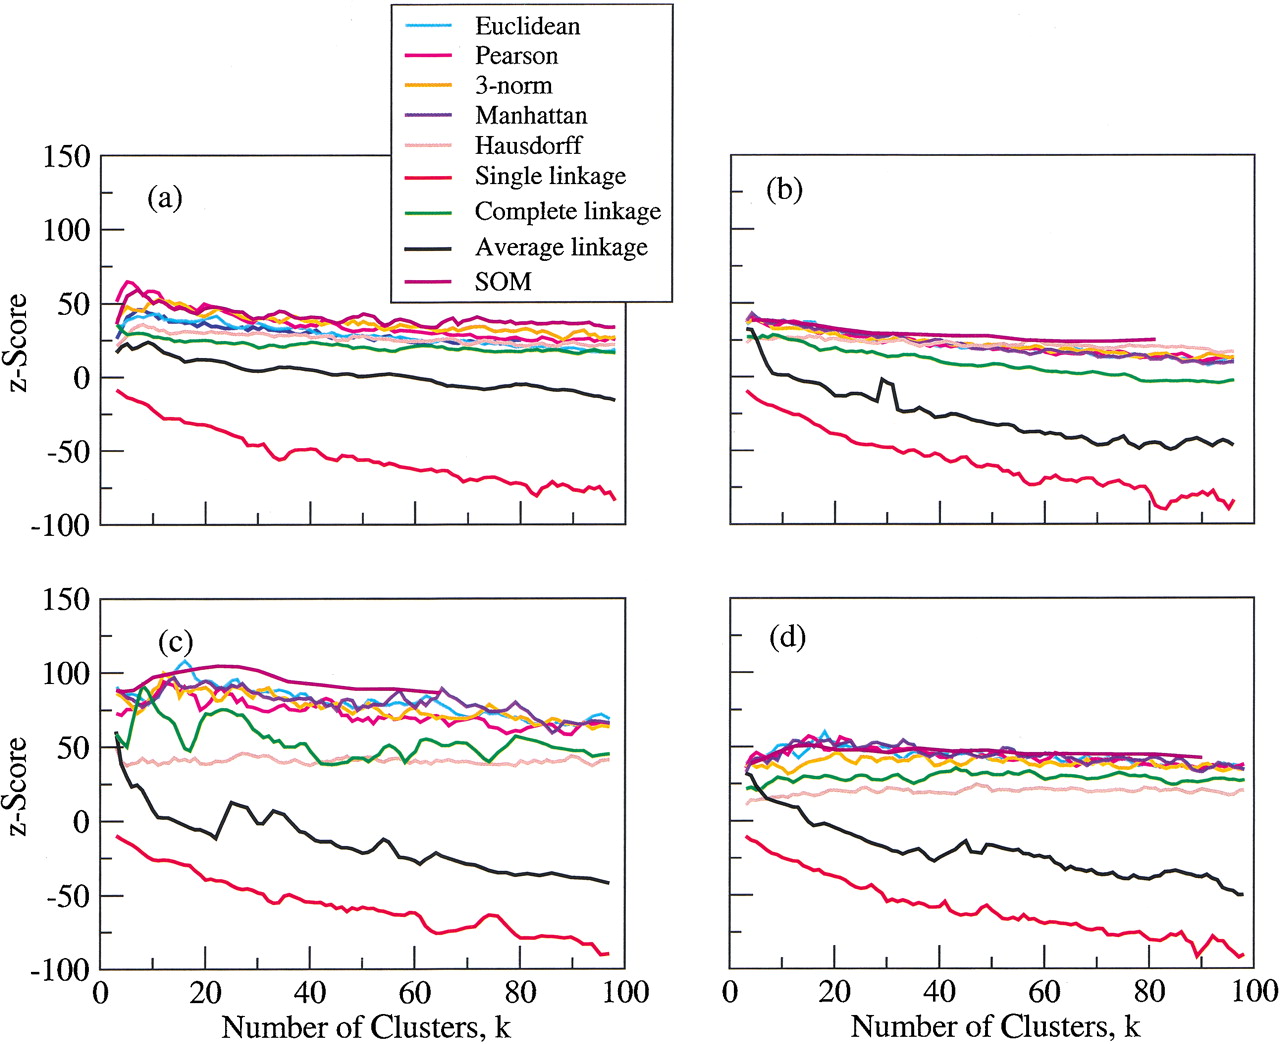
Judging the Quality of Gene Expression-Based Clustering Methods Using Gene Annotation

(Downloading may take up to 30 seconds. If the slide opens in your browser, select File -> Save As to save it.)

Click on image to view larger version.

Figure 2.
Figure 2.

Four data sets clustered using k-means, hierarchical, and self-organized map algorithms. The horizontal axis shows the number of clusters desired, and the vertical axis shows z-scores. Data sets are (a) Cho, (b) CJRR, (c) Gasch, and (d) Spellman.

This Article

  1. Genome Res. 12: 1574-1581

Preprint Server