
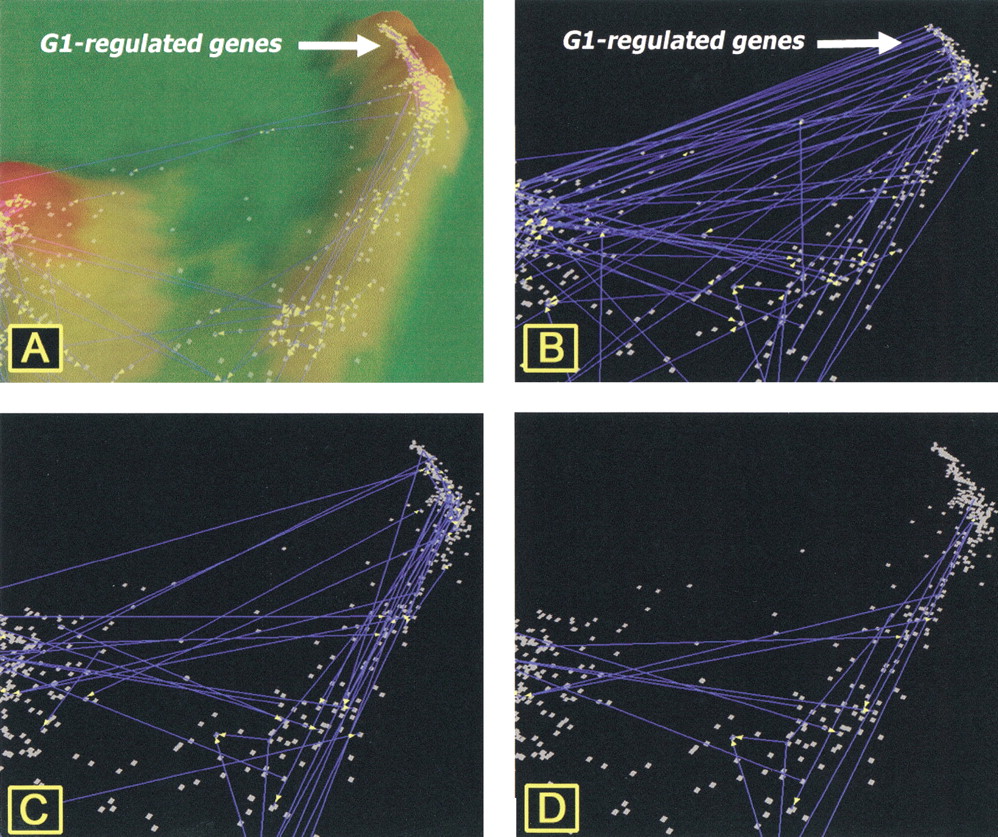
Figure 6.
Interactions among proteins encoded by G1-regulated genes from the cell-cycle data set. (A) Topographical presentation of G1-regulated gene cluster with connections between genes showing strong similarities (R > 0.887) of expression between genes. (B) Genes encoding interacting proteins from Ito's full data set. (C) Genes encoding interacting proteins reported from Schwikowski's data set. (D) Protein interactions in common to the two data sets. Connections between genes in B–Dindicate interactions occurring between proteins encoded by the specific genes.


