
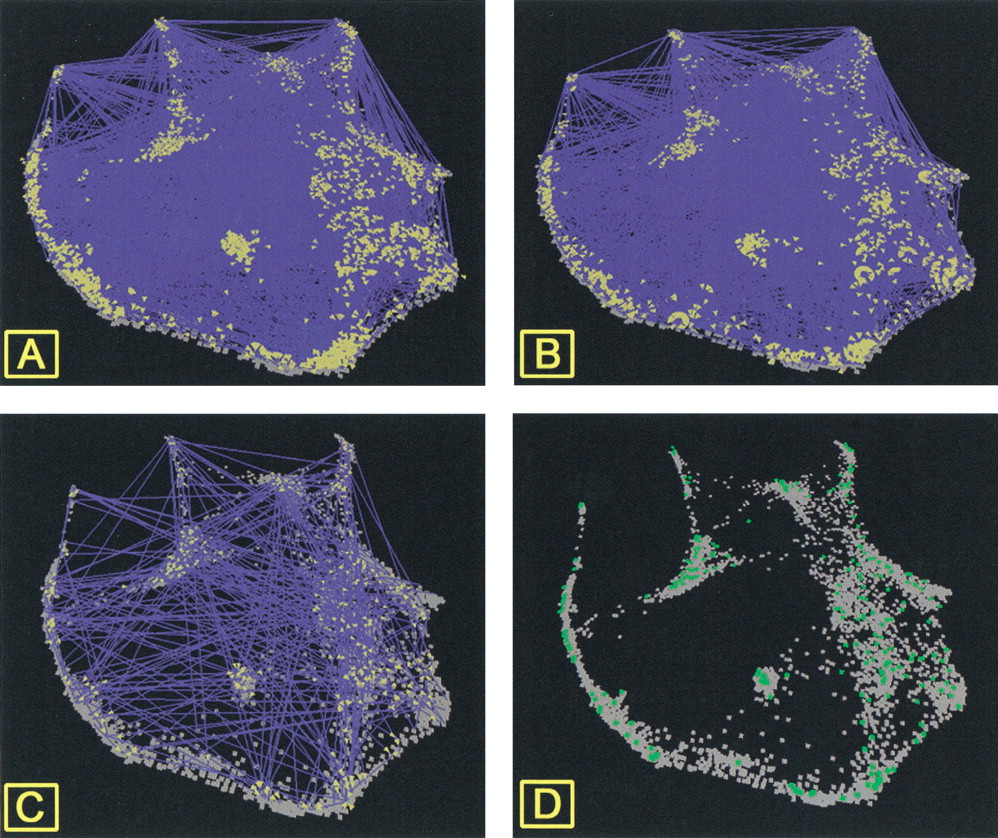
Figure 5.
Protein-protein interaction maps as a function of the cell-cycle gene-expression topography. Lines are drawn between genes encoding interacting proteins. (A) Schwikowski's complete data set. (B) Ito's full data set. (C) Protein-protein interactions reported from both data sets. (D) Genes encoding interacting proteins common to both data sets. In A andB, genes encoding proteins involved in interactions are indicated by yellow pyramids.


