
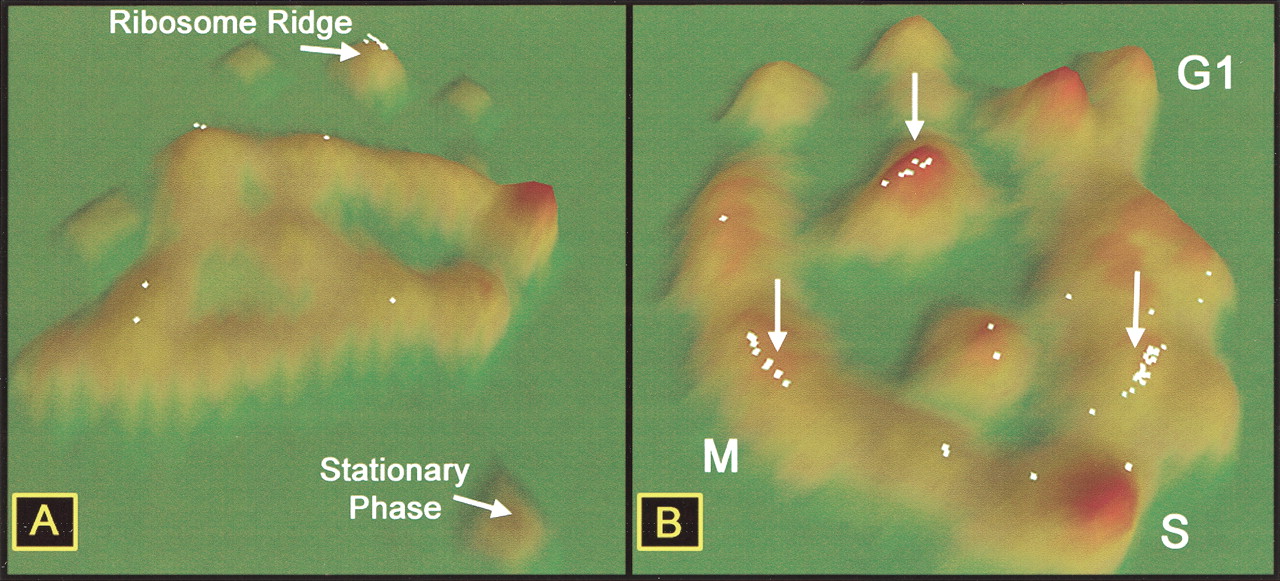
Figure 4.
Location of ribosomal protein genes (RPS genes) in two gene-expression data sets. (A) Location of RPS genes in exit from stationary phase data. Fifty-three of 59 RPS genes are localized in the upper middle cluster. (B) Localization of the same RPS genes in cell-cycle data set. Arrows indicate three major groups of RPS genes.


