
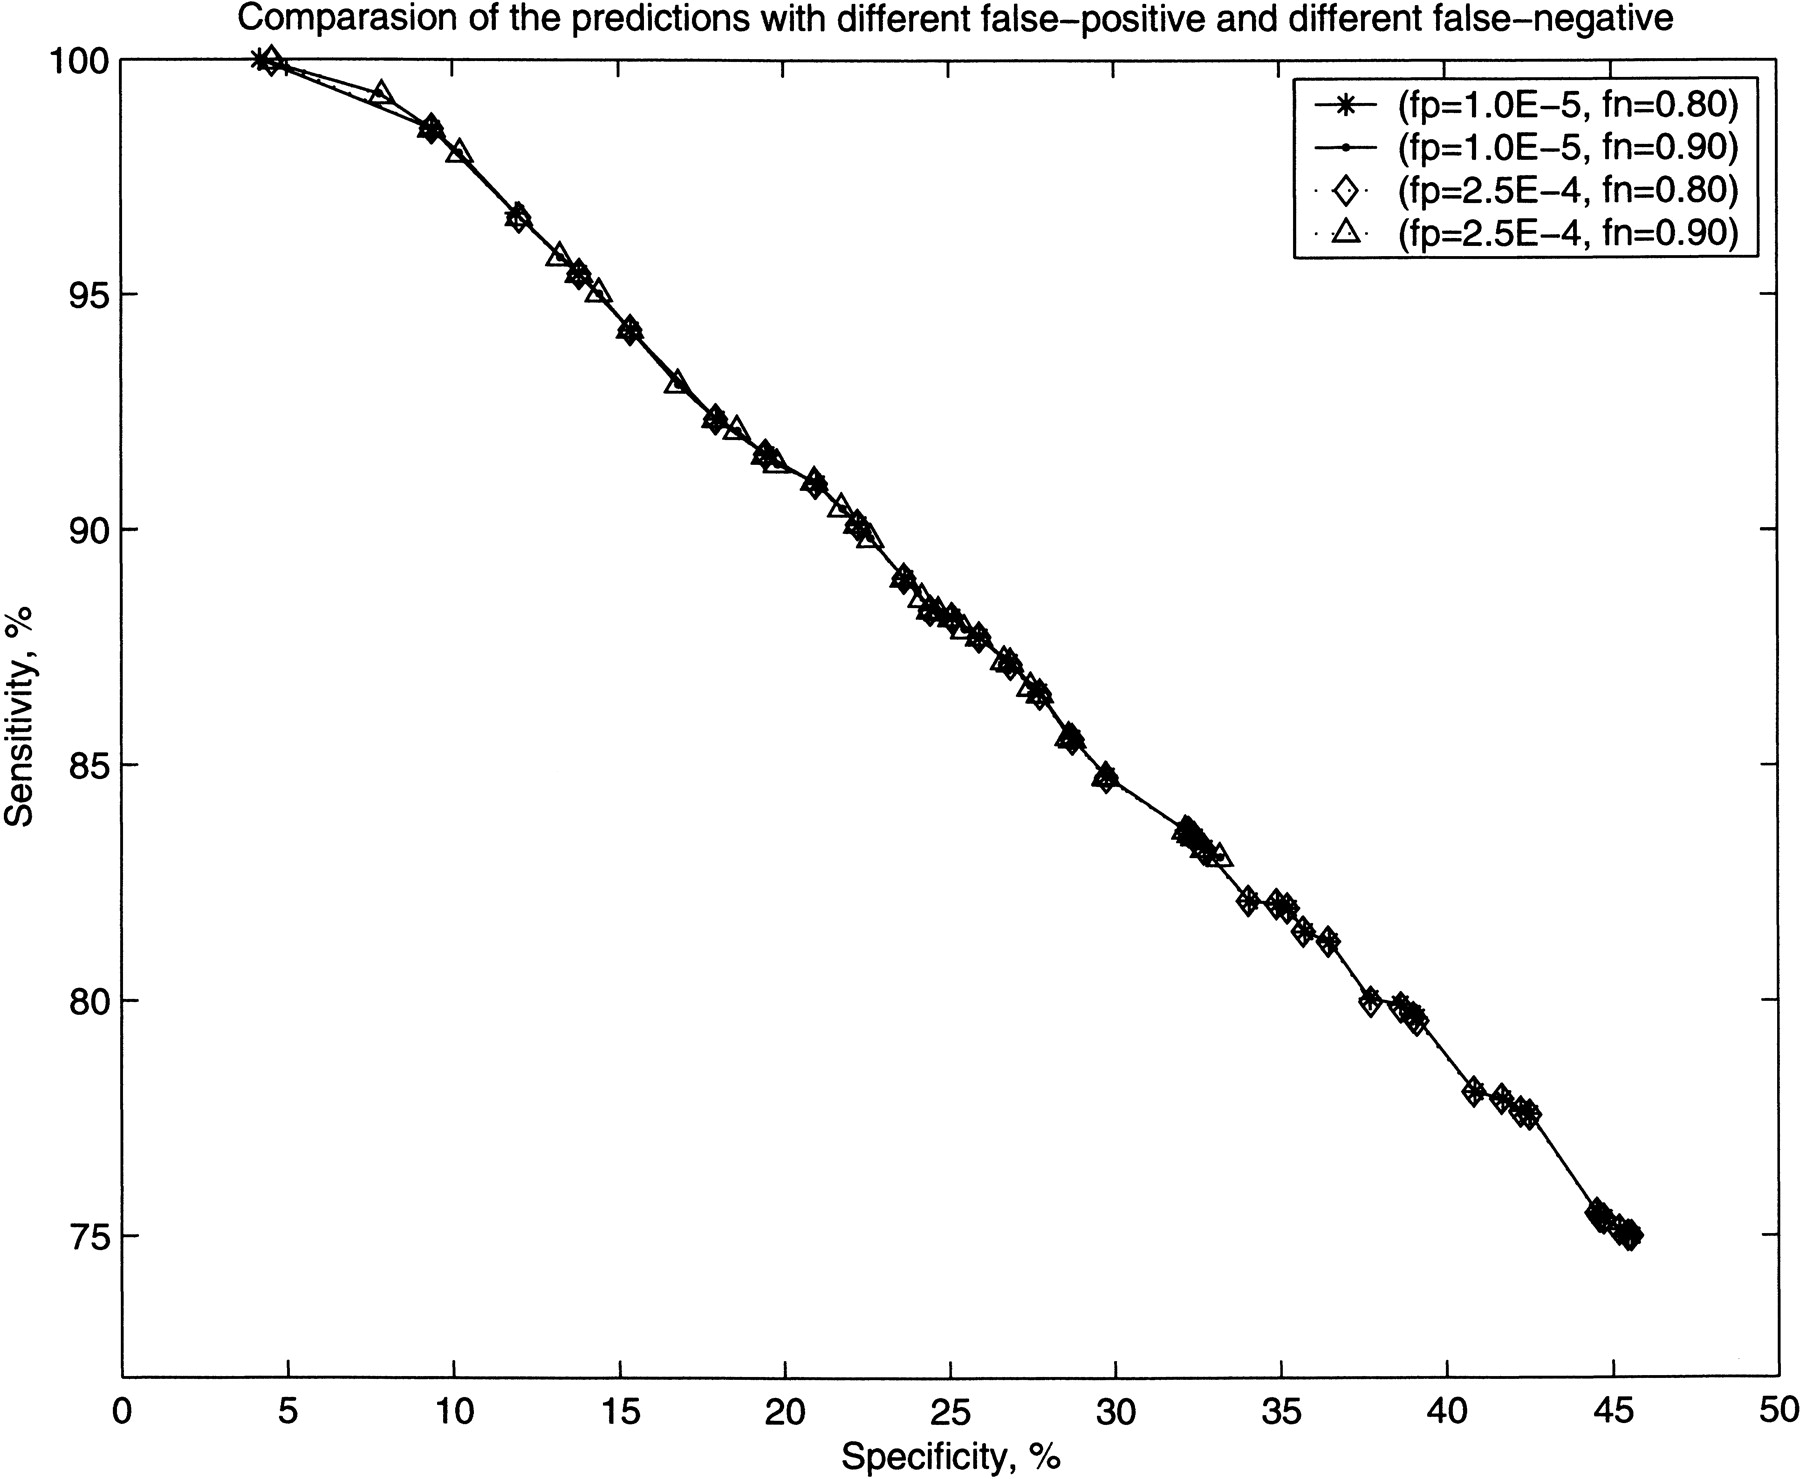
Figure 2.
Comparison of specificity and sensitivity of the prediction of protein–protein interactions by the maximum likelihood method for four different values of fp and fn .
(Downloading may take up to 30 seconds. If the slide opens in your browser, select File -> Save As to save it.)
Click on image to view larger version.
Comparison of specificity and sensitivity of the prediction of protein–protein interactions by the maximum likelihood method for four different values of fp and fn .
 CiteULike
 Delicious
 Digg
Digg Facebook
 Google+
 Reddit
 Twitter
