
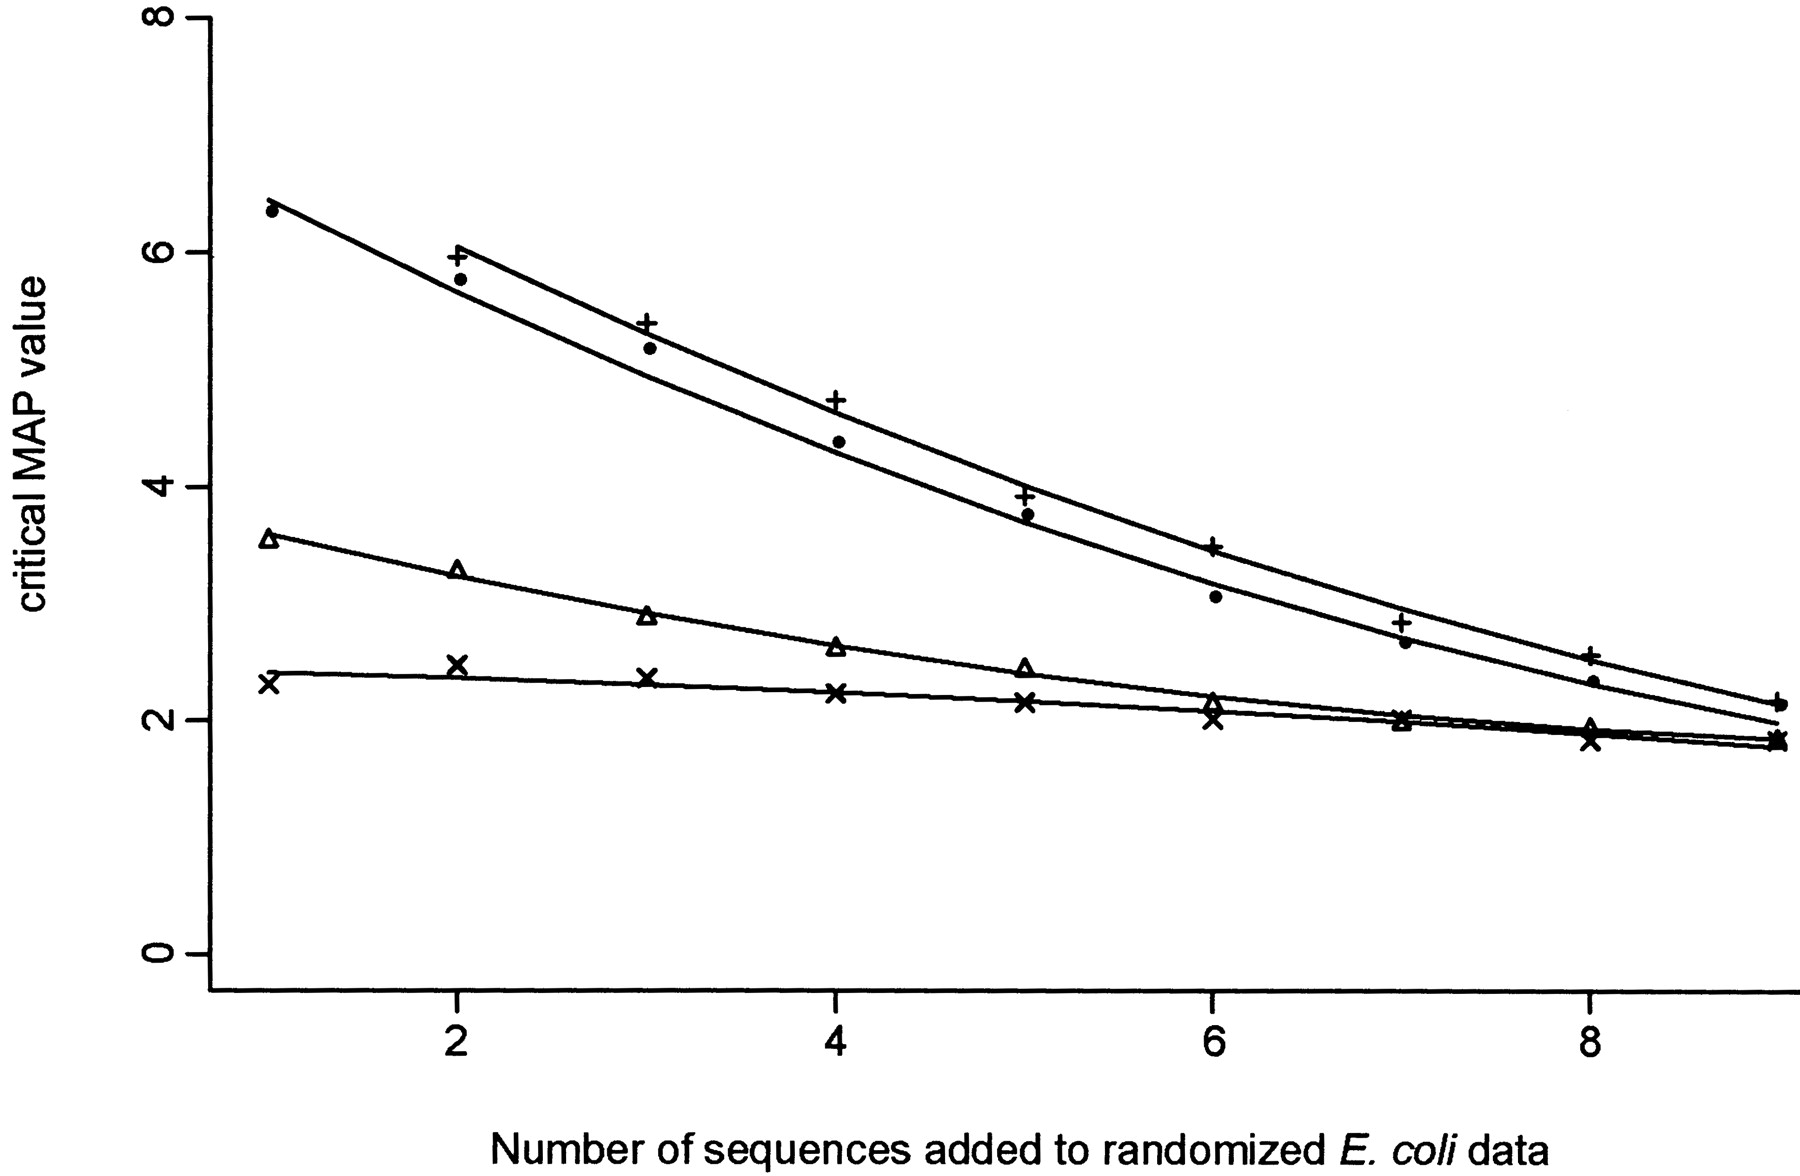
The critical maximum a posteriori probability (MAP) values for the 95% quantile (P = 0.05) calculated from the simulations for randomized Escherichia coli data plus k additional sequences (1 ≤ k ≤ 9): All additional sequences were randomized (crosses); one sequence was added at 48% identity (on average) to the randomized E. coli sequence, and additional sequences were randomized (triangles); one sequence was added at 70% identity (on average) to the randomized E. colisequence, and additional sequences were randomized (circles); one sequence was added at 48% identity (on average), another sequence was added at 70% identity (on average) to the randomized E. coli sequence, and additional sequences were randomized (plus symbols).


